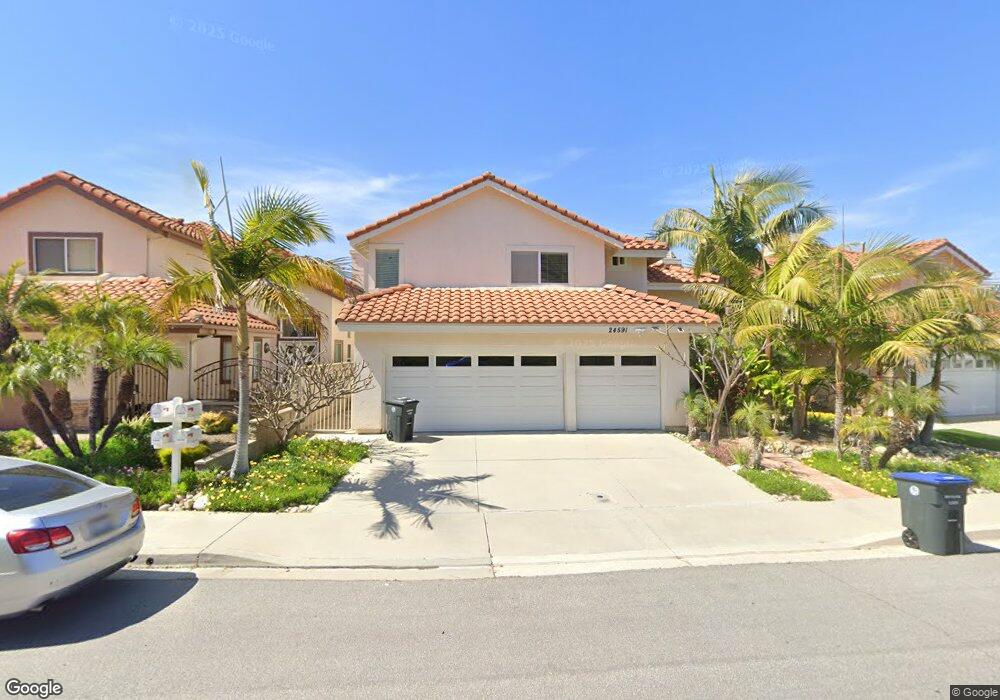
24591 Rue de Gauguin Laguna Niguel, CA 92677
Estimated Value: $1,456,000 - $1,642,000
4
Beds
3
Baths
2,221
Sq Ft
$680/Sq Ft
Est. Value
About This Home
This home is located at 24591 Rue de Gauguin, Laguna Niguel, CA 92677 and is currently estimated at $1,509,935, approximately $679 per square foot. 24591 Rue de Gauguin is a home located in Orange County with nearby schools including Hidden Hills Elementary, Niguel Hills Middle School, and Dana Hills High School.
Ownership History
Date
Name
Owned For
Owner Type
Purchase Details
Closed on
Dec 2, 2021
Sold by
Matsunaga Carol Lynn and Ogasa Steve Toshimi
Bought by
Ogasa Steve T and Matsunaga Carol L
Current Estimated Value
Home Financials for this Owner
Home Financials are based on the most recent Mortgage that was taken out on this home.
Original Mortgage
$302,049
Outstanding Balance
$277,731
Interest Rate
3.09%
Mortgage Type
New Conventional
Estimated Equity
$1,232,204
Purchase Details
Closed on
Sep 16, 2020
Sold by
Ogasa Steve Toshimi and Matsunaga Carol Lynn
Bought by
Ogasa Steve T and Ogasa Carol L
Purchase Details
Closed on
Dec 7, 1993
Sold by
Concorde Pacific Associates
Bought by
Ogasa Steve T and Matsunaga Carol Lynn
Home Financials for this Owner
Home Financials are based on the most recent Mortgage that was taken out on this home.
Original Mortgage
$243,000
Interest Rate
6.62%
Create a Home Valuation Report for This Property
The Home Valuation Report is an in-depth analysis detailing your home's value as well as a comparison with similar homes in the area
Home Values in the Area
Average Home Value in this Area
Purchase History
| Date | Buyer | Sale Price | Title Company |
|---|---|---|---|
| Ogasa Steve T | -- | Wfg Lender Services | |
| Matsunaga Carol Lynn | -- | Wfg Lender Services | |
| Ogasa Steve T | -- | None Available | |
| Ogasa Steve T | $265,000 | First American Title Ins Co |
Source: Public Records
Mortgage History
| Date | Status | Borrower | Loan Amount |
|---|---|---|---|
| Open | Matsunaga Carol Lynn | $302,049 | |
| Closed | Ogasa Steve T | $243,000 |
Source: Public Records
Tax History Compared to Growth
Tax History
| Year | Tax Paid | Tax Assessment Tax Assessment Total Assessment is a certain percentage of the fair market value that is determined by local assessors to be the total taxable value of land and additions on the property. | Land | Improvement |
|---|---|---|---|---|
| 2025 | $4,416 | $450,408 | $136,900 | $313,508 |
| 2024 | $4,416 | $441,577 | $134,216 | $307,361 |
| 2023 | $4,322 | $432,919 | $131,584 | $301,335 |
| 2022 | $4,309 | $424,431 | $129,004 | $295,427 |
| 2021 | $4,155 | $416,109 | $126,474 | $289,635 |
| 2020 | $4,113 | $411,843 | $125,177 | $286,666 |
| 2019 | $4,031 | $403,768 | $122,722 | $281,046 |
| 2018 | $3,952 | $395,851 | $120,315 | $275,536 |
| 2017 | $3,873 | $388,090 | $117,956 | $270,134 |
| 2016 | $3,798 | $380,481 | $115,643 | $264,838 |
| 2015 | $3,740 | $374,766 | $113,906 | $260,860 |
| 2014 | $3,666 | $367,425 | $111,674 | $255,751 |
Source: Public Records
Map
Nearby Homes
- 24625 Los Serranos Dr
- 24532 Kings View
- 24561 Los Serranos Dr
- 24255 Rue de Gauguin
- 24822 Cutter
- 24518 Sunshine Dr
- 30042 Oceanus
- 1 O'Hill
- 24471 Los Serranos Dr
- 24615 Kings Rd
- 24565 Camden Ct
- 25111 Adelanto Dr
- 24551 Camden Ct
- 24705 Queens Ct
- 25112 Armagosa Dr
- 24692 Sutton Ln
- 2 Corsica
- 24877 Nueva Vista Dr Unit 23
- 2 Novilla
- 23971 Stillwater Ln
- 24581 Rue de Gauguin
- 24595 Rue de Gauguin
- 24571 Rue de Gauguin
- 24561 Rue de Gauguin
- 24632 La Vida Dr
- 24555 Rue de Gauguin
- 24642 La Vida Dr
- 24551 Rue de Gauguin
- 24621 La Vida Dr
- 24611 La Vida Dr
- 24631 La Vida Dr
- 24541 Rue de Gauguin
- 24652 La Vida Dr
- 24641 La Vida Dr
- 24535 Rue de Gauguin
- 24632 La Plata Dr
- 24642 La Plata Dr
- 24656 La Vida Dr
- 24531 Rue de Gauguin
- 24651 La Vida Dr