Estimated Value: $117,693 - $177,000
Studio
2
Baths
1,360
Sq Ft
$105/Sq Ft
Est. Value
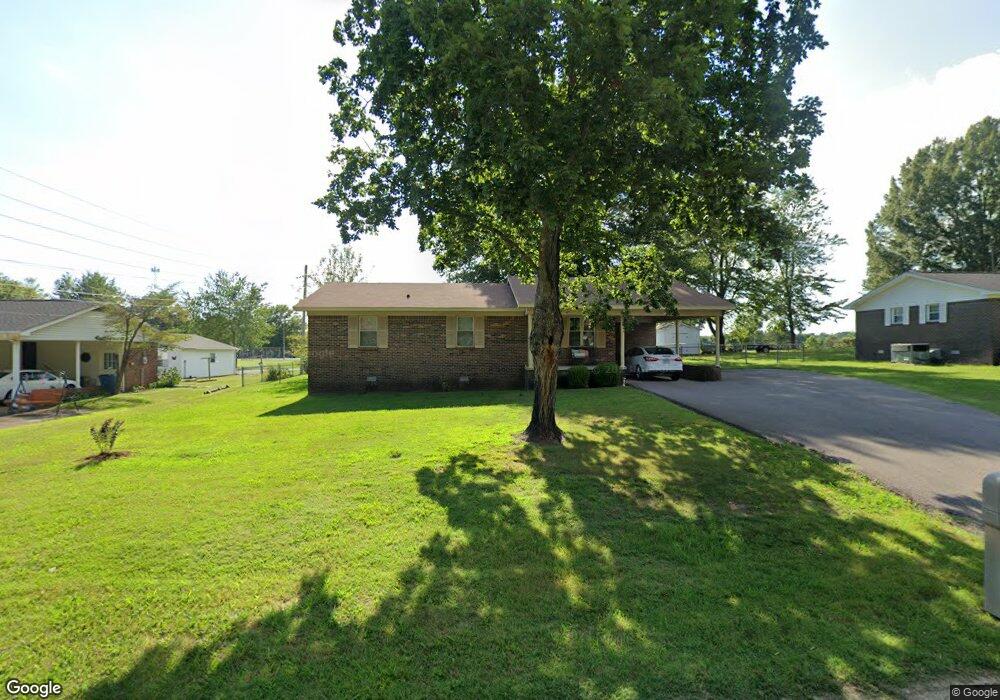
About This Home
This home is located at 246 Division St, Dyer, TN 38330 and is currently estimated at $142,173, approximately $104 per square foot. 246 Division St is a home located in Gibson County with nearby schools including Dyer Elementary School and Gibson County High School.
Ownership History
Date
Name
Owned For
Owner Type
Purchase Details
Closed on
May 2, 2022
Sold by
Booth Jr Burnis O
Bought by
Booth Burnis O and Booth Beverly
Current Estimated Value
Purchase Details
Closed on
Sep 25, 2014
Sold by
Jpmorgan Chase Bank National A
Bought by
Booth Burnis O
Purchase Details
Closed on
Jan 10, 2014
Sold by
Patrick Teresa
Bought by
Jpmorgan Chase Bank National A
Purchase Details
Closed on
Jan 27, 2005
Sold by
Rainwater John T
Bought by
Patrick Teresa
Home Financials for this Owner
Home Financials are based on the most recent Mortgage that was taken out on this home.
Original Mortgage
$84,660
Interest Rate
5.72%
Purchase Details
Closed on
May 17, 2000
Sold by
Barron Fanchon B
Bought by
Rainwater John T
Purchase Details
Closed on
Jan 6, 1989
Bought by
Barron Fanchon B
Purchase Details
Closed on
Jan 1, 1974
Bought by
Barron Jimmy R and Barron Fanchon B
Purchase Details
Closed on
Jan 2, 1900
Create a Home Valuation Report for This Property
The Home Valuation Report is an in-depth analysis detailing your home's value as well as a comparison with similar homes in the area
Purchase History
| Date | Buyer | Sale Price | Title Company |
|---|---|---|---|
| Booth Burnis O | -- | Johnson J Mark | |
| Booth Burnis O | $47,500 | -- | |
| Jpmorgan Chase Bank National A | $70,550 | -- | |
| Patrick Teresa | $83,000 | -- | |
| Rainwater John T | $66,000 | -- | |
| Barron Fanchon B | -- | -- | |
| Barron Jimmy R | -- | -- | |
| -- | -- | -- |
Source: Public Records
Mortgage History
| Date | Status | Borrower | Loan Amount |
|---|---|---|---|
| Previous Owner | Not Available | $84,660 |
Source: Public Records
Tax History
| Year | Tax Paid | Tax Assessment Tax Assessment Total Assessment is a certain percentage of the fair market value that is determined by local assessors to be the total taxable value of land and additions on the property. | Land | Improvement |
|---|---|---|---|---|
| 2025 | $937 | $25,900 | $3,500 | $22,400 |
| 2024 | $898 | $25,900 | $3,500 | $22,400 |
| 2023 | $502 | $16,125 | $2,025 | $14,100 |
| 2022 | $490 | $16,125 | $2,025 | $14,100 |
| 2021 | $490 | $16,125 | $2,025 | $14,100 |
| 2020 | $801 | $16,125 | $2,025 | $14,100 |
| 2019 | $776 | $16,125 | $2,025 | $14,100 |
| 2018 | $800 | $15,850 | $1,850 | $14,000 |
| 2017 | $768 | $15,850 | $1,850 | $14,000 |
| 2016 | $768 | $15,850 | $1,850 | $14,000 |
| 2015 | $700 | $15,850 | $1,850 | $14,000 |
| 2014 | $700 | $15,850 | $1,850 | $14,000 |
Source: Public Records
Map
Nearby Homes
- 205 Division St
- 403 E College St
- 115 High St
- 139 Peach St
- 142 S Poplar St
- 354 E Maple St
- 508 E College St
- 217 Central St
- 299 E Walnut St
- 303 E Walnut St
- 342 E Walnut St
- 208 & 210 Lee St
- 163 Monroe St
- 298 High St
- 226 Madison St
- 246 Thomas St
- 23 Gravettes Crossing Rd W
- 89 Old Dyer Yorkville Rd
- 148 Scattered Acres Loop
- 314 New Hope Rd
- 254 Division St
- 238 Division St
- 260 Division St
- 230 Division St
- 245 Division St
- 235 Division St
- 257 Division St
- 229 Division St
- 268 Division St
- 222 Division St
- 267 Division St
- 221 Division St
- 234 N Poplar St
- 250 N Poplar St
- 278 Division St
- 214 Division St
- 228 N Poplar St
- 258 N Poplar St
- 213 Division St
- 218 N Poplar St
Your Personal Tour Guide
Ask me questions while you tour the home.