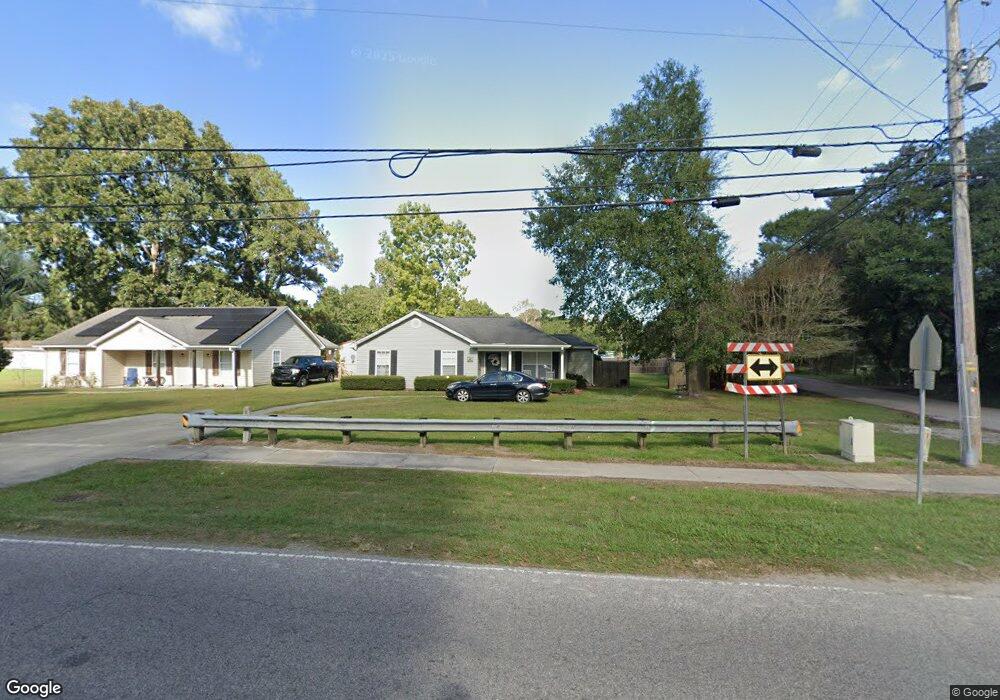
246 McDonald Rd Unit lot 2 Graham Lane Su Georgetown, SC 29440
Estimated Value: $200,000 - $239,000
3
Beds
2
Baths
1,248
Sq Ft
$176/Sq Ft
Est. Value
About This Home
This home is located at 246 McDonald Rd Unit lot 2 Graham Lane Su, Georgetown, SC 29440 and is currently estimated at $219,681, approximately $176 per square foot. 246 McDonald Rd Unit lot 2 Graham Lane Su is a home located in Georgetown County with nearby schools including McDonald Elementary School, Georgetown Middle School, and Georgetown High School.
Ownership History
Date
Name
Owned For
Owner Type
Purchase Details
Closed on
Dec 5, 2017
Sold by
T & P Realty Llc
Bought by
Holmes Shaquetta
Current Estimated Value
Home Financials for this Owner
Home Financials are based on the most recent Mortgage that was taken out on this home.
Original Mortgage
$113,975
Outstanding Balance
$95,808
Interest Rate
3.88%
Mortgage Type
New Conventional
Estimated Equity
$123,873
Purchase Details
Closed on
Aug 22, 2017
Sold by
Crosby Joe M
Bought by
M & T Bank
Purchase Details
Closed on
Nov 15, 2007
Sold by
Mango Bay Development Llc
Bought by
Patrick Martin Wayne and Patrick Sharon Rhea
Home Financials for this Owner
Home Financials are based on the most recent Mortgage that was taken out on this home.
Original Mortgage
$145,900
Interest Rate
6.36%
Mortgage Type
Purchase Money Mortgage
Create a Home Valuation Report for This Property
The Home Valuation Report is an in-depth analysis detailing your home's value as well as a comparison with similar homes in the area
Home Values in the Area
Average Home Value in this Area
Purchase History
| Date | Buyer | Sale Price | Title Company |
|---|---|---|---|
| Holmes Shaquetta | $117,500 | None Available | |
| M & T Bank | $82,500 | None Available | |
| Patrick Martin Wayne | $145,900 | Attorney |
Source: Public Records
Mortgage History
| Date | Status | Borrower | Loan Amount |
|---|---|---|---|
| Open | Holmes Shaquetta | $113,975 | |
| Previous Owner | Patrick Martin Wayne | $145,900 |
Source: Public Records
Tax History Compared to Growth
Tax History
| Year | Tax Paid | Tax Assessment Tax Assessment Total Assessment is a certain percentage of the fair market value that is determined by local assessors to be the total taxable value of land and additions on the property. | Land | Improvement |
|---|---|---|---|---|
| 2024 | $2,138 | $7,530 | $600 | $6,930 |
| 2023 | $2,138 | $7,530 | $600 | $6,930 |
| 2022 | $1,992 | $7,530 | $600 | $6,930 |
| 2021 | $1,937 | $0 | $0 | $0 |
| 2020 | $1,935 | $0 | $0 | $0 |
| 2019 | $1,807 | $0 | $0 | $0 |
| 2018 | $1,818 | $0 | $0 | $0 |
| 2017 | $1,893 | $0 | $0 | $0 |
| 2016 | $1,879 | $8,298 | $0 | $0 |
| 2015 | $1,843 | $0 | $0 | $0 |
| 2014 | $1,843 | $133,600 | $10,000 | $123,600 |
| 2012 | -- | $133,600 | $10,000 | $123,600 |
Source: Public Records
Map
Nearby Homes
- 85 Graham Ln
- 205 Glenda Loop
- 233 Glenda Loop
- 3240 Highmarket St
- 3431 Highmarket St
- 54 Juniper Place
- 514 Antebellum Ln
- 1939 Mauricena Rd
- 345 Player St
- 162 Savannah St Unit Lot 15 - Oak II
- 663 Player St
- 480 Lincolnshire Dr
- 183 Midway Rd
- 84 Greentown Rd
- 2527 Highmarket St
- 210 County Road S-22-577
- 0 Rainey Dr
- 621 Garden Ave
- 607 Garden Ave
- 902 Palm St
- 246 McDonald Rd
- 256 McDonald Rd
- 45 Graham Ln
- 55 Graham Ln
- 286 McDonald Rd
- 228 McDonald Rd
- 261 McDonald Rd
- 329 County Road S-22-71
- 65 Graham Ln
- 279 McDonald Rd
- 306 McDonald Rd
- 295 McDonald Rd
- 212 McDonald Rd
- 99 Graham Ln
- 115 Graham Ln
- 499 W Virginia Rd
- 499 W Virginia Rd Unit 487 West Virginia
- 340 McDonald Rd
- 118 Graham Ln
- 391 W Virginia Rd