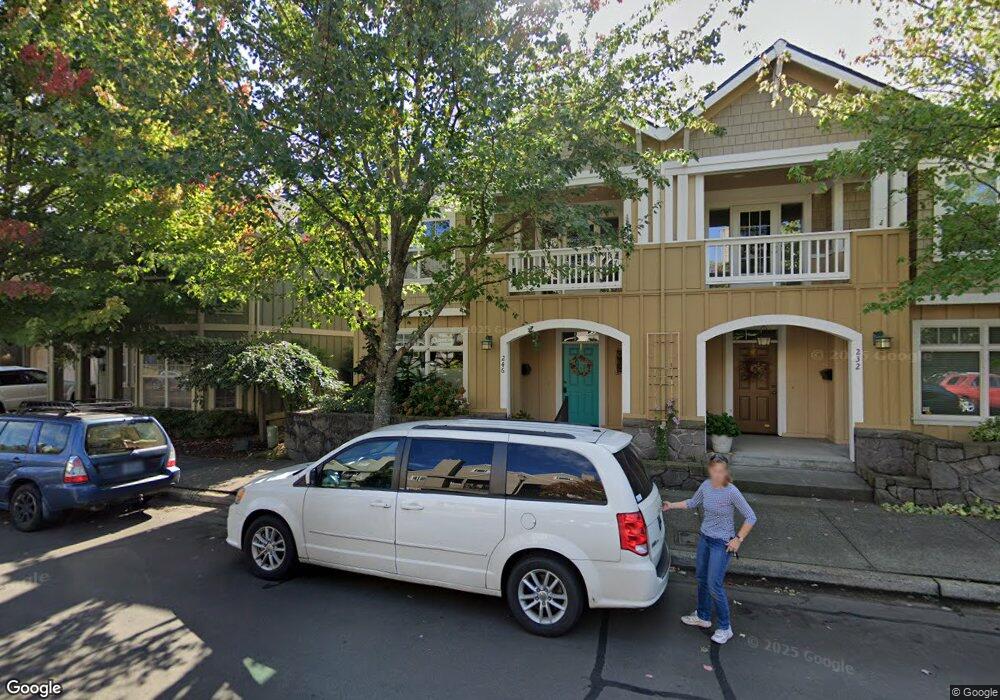
246 NE 4th St Gresham, OR 97030
Downtown Gresham NeighborhoodEstimated Value: $430,627 - $515,000
3
Beds
3
Baths
2,096
Sq Ft
$226/Sq Ft
Est. Value
About This Home
This home is located at 246 NE 4th St, Gresham, OR 97030 and is currently estimated at $474,657, approximately $226 per square foot. 246 NE 4th St is a home located in Multnomah County with nearby schools including East Gresham Elementary School, Dexter McCarty Middle School, and Gresham High School.
Ownership History
Date
Name
Owned For
Owner Type
Purchase Details
Closed on
Feb 14, 2007
Sold by
Hodapp Francis X
Bought by
Hodapp Francis X and Hodapp Louise G
Current Estimated Value
Home Financials for this Owner
Home Financials are based on the most recent Mortgage that was taken out on this home.
Original Mortgage
$93,350
Outstanding Balance
$55,661
Interest Rate
6.17%
Mortgage Type
Stand Alone Refi Refinance Of Original Loan
Estimated Equity
$418,996
Purchase Details
Closed on
Feb 8, 2007
Sold by
Hodapp Francis X
Bought by
Hodapp Francis X and Hodapp Louise G
Home Financials for this Owner
Home Financials are based on the most recent Mortgage that was taken out on this home.
Original Mortgage
$93,350
Outstanding Balance
$55,661
Interest Rate
6.17%
Mortgage Type
Stand Alone Refi Refinance Of Original Loan
Estimated Equity
$418,996
Purchase Details
Closed on
Aug 22, 2001
Sold by
Hodapp Francis X
Bought by
Hodapp Francis X and Hodapp Louise G
Home Financials for this Owner
Home Financials are based on the most recent Mortgage that was taken out on this home.
Original Mortgage
$95,000
Interest Rate
7.21%
Mortgage Type
Purchase Money Mortgage
Create a Home Valuation Report for This Property
The Home Valuation Report is an in-depth analysis detailing your home's value as well as a comparison with similar homes in the area
Home Values in the Area
Average Home Value in this Area
Purchase History
| Date | Buyer | Sale Price | Title Company |
|---|---|---|---|
| Hodapp Francis X | -- | Accommodation | |
| Hodapp Francis X | -- | Chicago Title Insurance Co | |
| Hodapp Francis X | -- | Fidelity National Title | |
| Hodapp Francis X | $247,000 | Fidelity National Title |
Source: Public Records
Mortgage History
| Date | Status | Borrower | Loan Amount |
|---|---|---|---|
| Open | Hodapp Francis X | $93,350 | |
| Closed | Hodapp Francis X | $95,000 |
Source: Public Records
Tax History
| Year | Tax Paid | Tax Assessment Tax Assessment Total Assessment is a certain percentage of the fair market value that is determined by local assessors to be the total taxable value of land and additions on the property. | Land | Improvement |
|---|---|---|---|---|
| 2025 | $6,281 | $308,630 | -- | -- |
| 2024 | $6,012 | $299,650 | -- | -- |
| 2023 | $5,478 | $290,930 | $0 | $0 |
| 2022 | $5,324 | $282,460 | $0 | $0 |
| 2021 | $5,190 | $274,240 | $0 | $0 |
| 2020 | $4,884 | $266,260 | $0 | $0 |
| 2019 | $4,756 | $258,510 | $0 | $0 |
| 2018 | $4,535 | $250,990 | $0 | $0 |
| 2017 | $4,351 | $243,680 | $0 | $0 |
| 2016 | $3,836 | $236,590 | $0 | $0 |
Source: Public Records
Map
Nearby Homes
- 318 NE Roberts Ave Unit 308
- 318 NE Roberts Ave Unit 203
- 210 NE 5th St
- 0 NE 5th St
- 491 NE Elliott Ave
- 660 NE 9th St
- 415 SE Roberts Ave
- 894 NE Linden Ave
- 417 SE Roberts Ave
- 234 NE Cleveland Ave
- 54 NW 13th St
- 0 NE 6th St
- 638 SW 7th St
- 4740 SE 2nd St
- 4764 SE 2nd St
- 4667 SE 2nd St
- 1783 1791 NE Beech Place
- 159 SW Florence Ave Unit 64
- 159 SW Florence Ave
- 1113 W Powell Blvd
- 232 NE 4th St
- 266 NE 4th St
- 239 NE 3rd St Unit C102
- 313 NE Hood Ave Unit C105
- 214 NE 4th St
- 329 NE Hood Ave Unit C106
- 347 NE Hood Ave Unit C107
- 282 NE 4th St
- 288 NE 4th St
- 208 NE 4th St
- 287 NE 3rd St Unit C104
- 287 NE 3rd St Unit C103
- 287 NE 3rd St Unit C101
- 287 NE 3rd St Unit R312
- 287 NE 3rd St Unit R311
- 287 NE 3rd St Unit R310
- 287 NE 3rd St Unit R309
- 287 NE 3rd St Unit R308
- 287 NE 3rd St Unit R307
- 287 NE 3rd St Unit R306
Your Personal Tour Guide
Ask me questions while you tour the home.