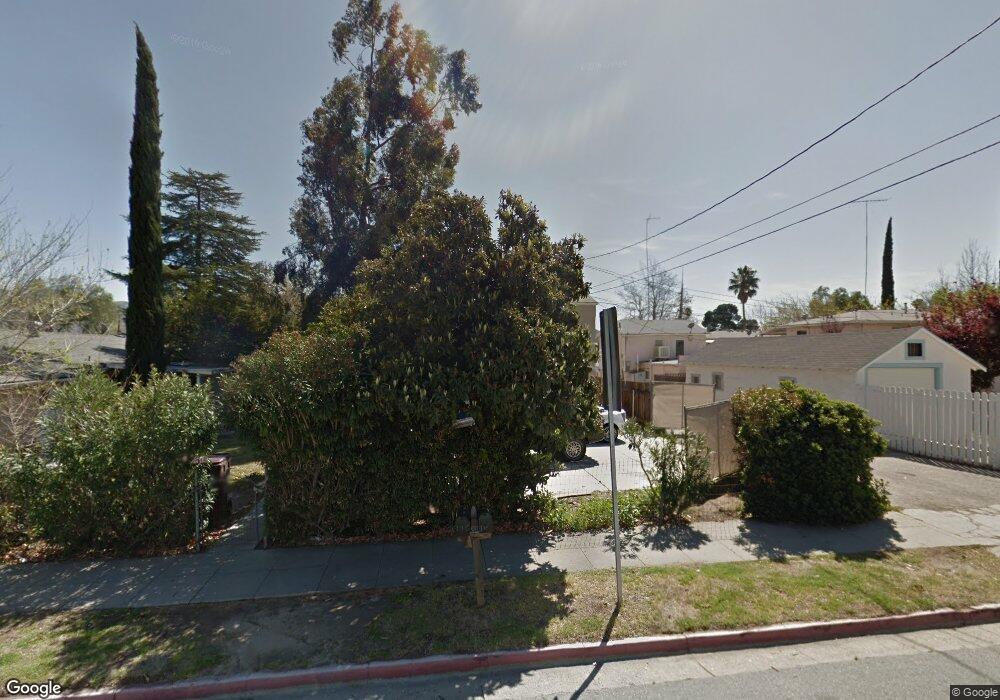
246 W Nicolet St Banning, CA 92220
Estimated Value: $409,000 - $430,000
2
Beds
1
Bath
1,440
Sq Ft
$291/Sq Ft
Est. Value
About This Home
This home is located at 246 W Nicolet St, Banning, CA 92220 and is currently estimated at $419,333, approximately $291 per square foot. 246 W Nicolet St is a home located in Riverside County with nearby schools including Banning High School.
Ownership History
Date
Name
Owned For
Owner Type
Purchase Details
Closed on
Feb 22, 2023
Sold by
Silavong Somsack and Silavong Kathy
Bought by
Somsack And Kathy Silavong Living Trust
Current Estimated Value
Purchase Details
Closed on
Jun 12, 2012
Sold by
Delgado Daniel
Bought by
Silavong Somsack and Silavong Kathy
Home Financials for this Owner
Home Financials are based on the most recent Mortgage that was taken out on this home.
Original Mortgage
$105,000
Interest Rate
3.62%
Mortgage Type
Commercial
Purchase Details
Closed on
Feb 23, 2006
Sold by
Delgado Daniel
Bought by
Delgado Daniel
Purchase Details
Closed on
Oct 30, 2000
Sold by
Schenden Herbert J and Schenden Laurie K
Bought by
Martin Donald Lee and Martin Zulema
Home Financials for this Owner
Home Financials are based on the most recent Mortgage that was taken out on this home.
Original Mortgage
$95,000
Interest Rate
7.71%
Mortgage Type
Seller Take Back
Create a Home Valuation Report for This Property
The Home Valuation Report is an in-depth analysis detailing your home's value as well as a comparison with similar homes in the area
Home Values in the Area
Average Home Value in this Area
Purchase History
| Date | Buyer | Sale Price | Title Company |
|---|---|---|---|
| Somsack And Kathy Silavong Living Trust | -- | None Listed On Document | |
| Silavong Somsack & Kathy Living Trust | -- | None Listed On Document | |
| Silavong Somsack | $150,000 | Lawyers Title | |
| Delgado Daniel | -- | None Available | |
| Martin Donald Lee | $105,000 | Gateway Title Company |
Source: Public Records
Mortgage History
| Date | Status | Borrower | Loan Amount |
|---|---|---|---|
| Previous Owner | Silavong Somsack | $105,000 | |
| Previous Owner | Martin Donald Lee | $95,000 |
Source: Public Records
Tax History Compared to Growth
Tax History
| Year | Tax Paid | Tax Assessment Tax Assessment Total Assessment is a certain percentage of the fair market value that is determined by local assessors to be the total taxable value of land and additions on the property. | Land | Improvement |
|---|---|---|---|---|
| 2025 | $1,603 | $114,506 | $24,619 | $89,887 |
| 2023 | $1,603 | $110,062 | $23,664 | $86,398 |
| 2022 | $1,569 | $107,904 | $23,200 | $84,704 |
| 2021 | $1,540 | $105,790 | $22,746 | $83,044 |
| 2020 | $1,525 | $104,706 | $22,513 | $82,193 |
| 2019 | $1,501 | $102,654 | $22,072 | $80,582 |
| 2018 | $1,491 | $100,642 | $21,641 | $79,001 |
| 2017 | $1,466 | $98,669 | $21,217 | $77,452 |
| 2016 | $1,395 | $96,735 | $20,801 | $75,934 |
| 2015 | $1,376 | $95,285 | $20,490 | $74,795 |
| 2014 | $1,367 | $93,421 | $20,090 | $73,331 |
Source: Public Records
Map
Nearby Homes
- 545 N 2nd St
- 182 N 4th St
- 546 N 5th St
- 661 N 4th St
- 0 Gorgonio Rd Unit SW25208341
- 640 W Nicolet St
- 501 W Ramsey St Unit 41
- 501 W Ramsey St Unit 19
- 676 W Nicolet St
- 579 W Livingston St
- 688 W Nicolet St
- 470 W Wilson St
- 958 N 1st St
- 883 W Nicolet St
- 0 E Hoffer St
- 911 W George St
- 1065 N San Gorgonio Ave
- 0 W King St Unit IV25225459
- 0 W King St Unit IV25225455
- 0 W King St Unit IV25225460