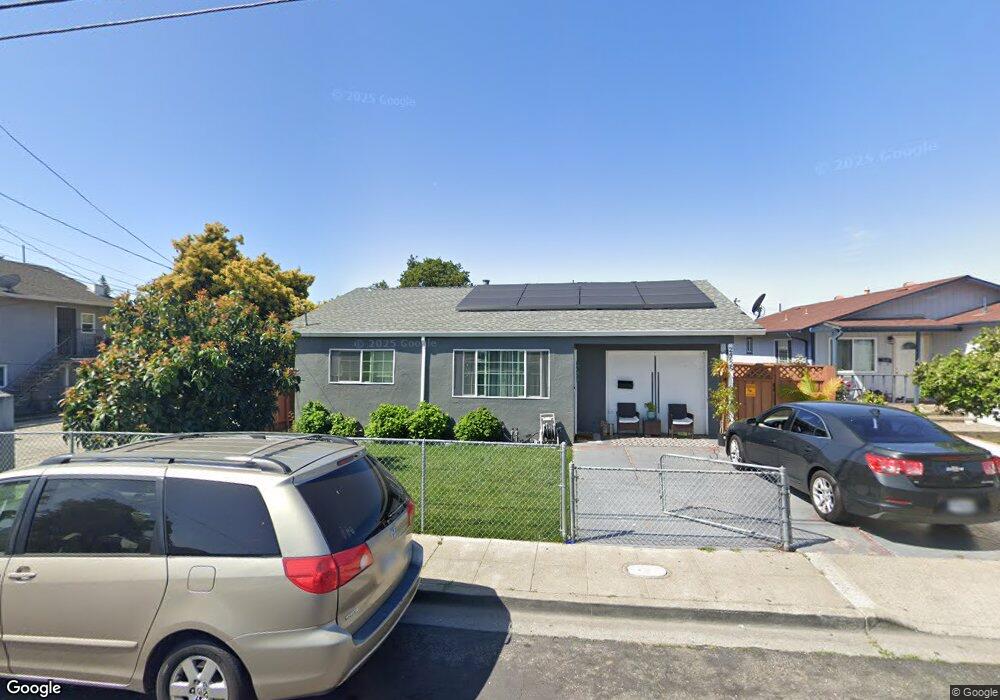
24625 Thomas Ave Hayward, CA 94544
Jackson Triangle NeighborhoodEstimated Value: $723,000 - $819,789
2
Beds
2
Baths
1,299
Sq Ft
$594/Sq Ft
Est. Value
About This Home
This home is located at 24625 Thomas Ave, Hayward, CA 94544 and is currently estimated at $771,947, approximately $594 per square foot. 24625 Thomas Ave is a home located in Alameda County with nearby schools including Harder Elementary School, Winton Middle School, and Hayward High School.
Ownership History
Date
Name
Owned For
Owner Type
Purchase Details
Closed on
May 19, 2021
Sold by
Covarrubias Carlos
Bought by
Nieblas Ricardo Amezcua and Zarco Laura Mendez
Current Estimated Value
Home Financials for this Owner
Home Financials are based on the most recent Mortgage that was taken out on this home.
Original Mortgage
$472,150
Outstanding Balance
$427,217
Interest Rate
3%
Mortgage Type
New Conventional
Estimated Equity
$344,730
Purchase Details
Closed on
Feb 3, 2005
Sold by
Black Bruce R
Bought by
Covarrubias Carlos
Home Financials for this Owner
Home Financials are based on the most recent Mortgage that was taken out on this home.
Original Mortgage
$348,000
Interest Rate
6.12%
Mortgage Type
Purchase Money Mortgage
Create a Home Valuation Report for This Property
The Home Valuation Report is an in-depth analysis detailing your home's value as well as a comparison with similar homes in the area
Home Values in the Area
Average Home Value in this Area
Purchase History
| Date | Buyer | Sale Price | Title Company |
|---|---|---|---|
| Nieblas Ricardo Amezcua | $497,000 | Fidelity National Ttl Mclpc | |
| Covarrubias Carlos | $435,000 | North American Title Co | |
| Covarrubias Carlos | -- | North American Title Co |
Source: Public Records
Mortgage History
| Date | Status | Borrower | Loan Amount |
|---|---|---|---|
| Open | Nieblas Ricardo Amezcua | $472,150 | |
| Previous Owner | Covarrubias Carlos | $348,000 | |
| Closed | Covarrubias Carlos | $87,000 |
Source: Public Records
Tax History
| Year | Tax Paid | Tax Assessment Tax Assessment Total Assessment is a certain percentage of the fair market value that is determined by local assessors to be the total taxable value of land and additions on the property. | Land | Improvement |
|---|---|---|---|---|
| 2025 | $9,343 | $772,341 | $233,802 | $545,539 |
| 2024 | $9,343 | $757,063 | $229,219 | $534,844 |
| 2023 | $9,202 | $749,087 | $224,726 | $524,361 |
| 2022 | $9,021 | $727,400 | $220,320 | $514,080 |
| 2021 | $7,907 | $626,613 | $168,039 | $458,574 |
| 2020 | $8,780 | $620,190 | $166,317 | $453,873 |
| 2019 | $7,991 | $543,523 | $163,057 | $380,466 |
| 2018 | $7,523 | $532,870 | $159,861 | $373,009 |
| 2017 | $6,567 | $460,000 | $138,000 | $322,000 |
| 2016 | $5,601 | $395,000 | $118,500 | $276,500 |
| 2015 | $5,111 | $360,000 | $108,000 | $252,000 |
| 2014 | $4,691 | $335,000 | $100,500 | $234,500 |
Source: Public Records
Map
Nearby Homes
- 24675 Joanne St
- 24386 Thomas Ave
- 24988 Plum Tree St
- 25231 Whitman St Unit 103
- 75 Middleton Place
- 58 Trestle Dr
- 229 Spring Harvest Rd
- 245 Spring Harvest Rd
- 25482 Franklin Ave
- 537 Dean St
- 945 Fletcher Ln Unit A330
- 73 Fernridge Ct Unit 73
- 22876 Charing St
- 25422 Parklane Dr
- 22964 Alice St
- 568 Dean St
- 22894 Kingsford Way
- 944 Walpert St
- 99 Austin Ave
- 25478 Huntwood Ave Unit 18
- 24613 Thomas Ave
- 24633 Thomas Ave
- 24595 Thomas Ave
- 24687 Pontiac St
- 24696 Dale St
- 24624 Thomas Ave
- 24636 Thomas Ave
- 24583 Thomas Ave
- 24649 Thomas Ave
- 24612 Thomas Ave
- 24684 Dale St
- 24648 Thomas Ave
- 24814 Arvilla Ln
- 24679 Pontiac St
- 24594 Thomas Ave
- 24677 Pontiac St
- 24571 Thomas Ave
- 24660 Thomas Ave
- 24672 Dale St
- 24582 Thomas Ave
Your Personal Tour Guide
Ask me questions while you tour the home.