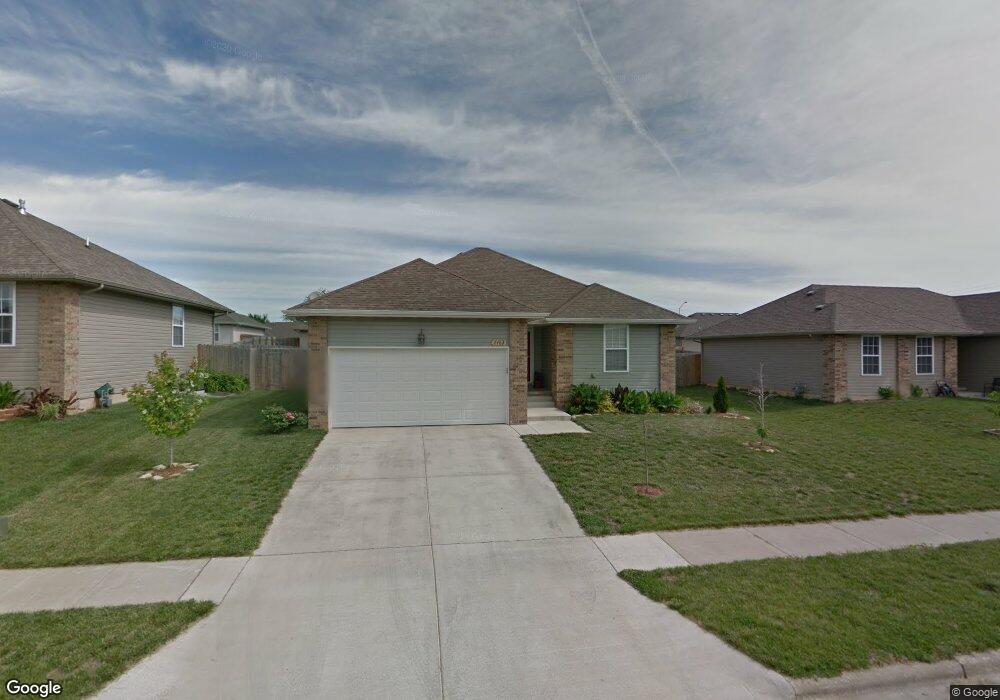
2463 Cedar Creek Dr Springfield, MO 65803
Estimated Value: $213,000 - $261,000
3
Beds
2
Baths
1,200
Sq Ft
$190/Sq Ft
Est. Value
About This Home
This home is located at 2463 Cedar Creek Dr, Springfield, MO 65803 and is currently estimated at $227,838, approximately $189 per square foot. 2463 Cedar Creek Dr is a home located in Greene County with nearby schools including Watkins Elementary School, Reed Academy, and Hillcrest High School.
Ownership History
Date
Name
Owned For
Owner Type
Purchase Details
Closed on
Aug 26, 2011
Sold by
Adamson Ryan J and Adamson Abby M
Bought by
Lloyd Thomas E
Current Estimated Value
Home Financials for this Owner
Home Financials are based on the most recent Mortgage that was taken out on this home.
Original Mortgage
$92,493
Outstanding Balance
$66,959
Interest Rate
5.5%
Mortgage Type
FHA
Estimated Equity
$160,879
Purchase Details
Closed on
Jun 25, 2009
Sold by
Cantrells Patriot Homes Inc
Bought by
Adamson Ryan J and Adamson Abbey M
Home Financials for this Owner
Home Financials are based on the most recent Mortgage that was taken out on this home.
Original Mortgage
$91,315
Interest Rate
4.97%
Mortgage Type
FHA
Purchase Details
Closed on
Apr 24, 2009
Sold by
Twin Lakes Properties Llc
Bought by
Cantrells Patriot Homes Inc
Home Financials for this Owner
Home Financials are based on the most recent Mortgage that was taken out on this home.
Original Mortgage
$80,000
Interest Rate
4.84%
Mortgage Type
Future Advance Clause Open End Mortgage
Create a Home Valuation Report for This Property
The Home Valuation Report is an in-depth analysis detailing your home's value as well as a comparison with similar homes in the area
Purchase History
| Date | Buyer | Sale Price | Title Company |
|---|---|---|---|
| Lloyd Thomas E | -- | None Available | |
| Adamson Ryan J | -- | None Available | |
| Cantrells Patriot Homes Inc | -- | None Available |
Source: Public Records
Mortgage History
| Date | Status | Borrower | Loan Amount |
|---|---|---|---|
| Open | Lloyd Thomas E | $92,493 | |
| Previous Owner | Adamson Ryan J | $91,315 | |
| Previous Owner | Cantrells Patriot Homes Inc | $80,000 |
Source: Public Records
Tax History
| Year | Tax Paid | Tax Assessment Tax Assessment Total Assessment is a certain percentage of the fair market value that is determined by local assessors to be the total taxable value of land and additions on the property. | Land | Improvement |
|---|---|---|---|---|
| 2025 | $1,413 | $27,040 | $5,190 | $21,850 |
| 2024 | $1,266 | $22,550 | $2,220 | $20,330 |
| 2023 | $1,259 | $22,550 | $2,220 | $20,330 |
| 2022 | $1,073 | $19,360 | $2,220 | $17,140 |
| 2021 | $1,072 | $19,360 | $2,220 | $17,140 |
| 2020 | $1,102 | $18,880 | $2,220 | $16,660 |
| 2019 | $1,070 | $18,880 | $2,220 | $16,660 |
| 2018 | $1,044 | $18,320 | $3,400 | $14,920 |
| 2017 | $1,034 | $17,330 | $3,400 | $13,930 |
| 2016 | $977 | $17,330 | $3,400 | $13,930 |
| 2015 | $968 | $17,330 | $3,400 | $13,930 |
| 2014 | $976 | $17,330 | $3,400 | $13,930 |
Source: Public Records
Map
Nearby Homes
- 2499 W Cedar Creek Dr
- 2406 W Spring Water St
- 000 Missouri 13
- Lot 6 N Farm Rd 139
- 000 Highland Acres
- Lot 4 N Full Bright Ave
- Lot 9 N Ethyl Ave
- Lot 11 N Ethyl Ave
- Lot 4 N Farm Rd 139
- 1835 W Farm Road 102
- 3486 N Farm Road 143
- 3031 W Augusta Hills St
- 1420 W Farm Road 102
- 3879 N Williams Ct
- 3877 N Daniels Ct
- 1158 W Bradley St
- 3229 W McClernon St
- 000 N Farm Road 127
- 1122 W Vancouver St
- 2488 W Farm Road 112
- 2463 W Cedar Creek Dr
- 2451 Cedar Creek Dr
- 2451 W Cedar Creek Dr
- 2475 Cedar Creek Dr
- 2475 W Cedar Creek Dr
- 2468 W Brook Ridge St
- 2456 W Brook Ridge St
- 2487 Cedar Creek Dr
- 2439 W Cedar Creek Dr
- 2487 W Cedar Creek Dr
- 2462 W Cedar Creek Dr
- 2439 Cedar Creek Dr
- 2462 Cedar Creek Dr
- 2474 W Cedar Creek Dr
- 2444 W Brook Ridge St
- 2450 W Cedar Creek Dr
- 2450 Cedar Creek Dr
- 2474 Cedar Creek Dr
- 2492 W Brook Ridge St
- 2438 W Cedar Creek Dr
Your Personal Tour Guide
Ask me questions while you tour the home.