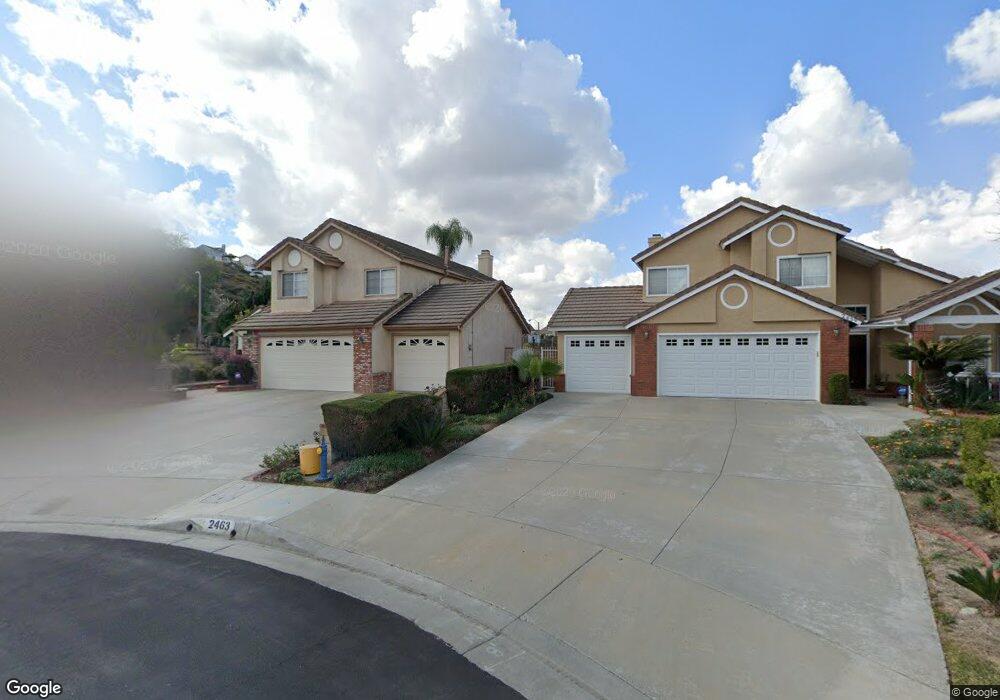
2463 Clay Ct Rowland Heights, CA 91748
Estimated Value: $1,128,092 - $1,608,000
3
Beds
3
Baths
2,161
Sq Ft
$600/Sq Ft
Est. Value
About This Home
This home is located at 2463 Clay Ct, Rowland Heights, CA 91748 and is currently estimated at $1,295,523, approximately $599 per square foot. 2463 Clay Ct is a home located in Los Angeles County with nearby schools including Shelyn Elementary School, Alvarado Intermediate School, and John A. Rowland High School.
Ownership History
Date
Name
Owned For
Owner Type
Purchase Details
Closed on
Jul 11, 2011
Sold by
Kim Bong Sik and Kim Sang Sook
Bought by
Kim Bong Sik and Kim Sang Sook
Current Estimated Value
Purchase Details
Closed on
Aug 17, 2010
Sold by
Kim Shin Annie
Bought by
Kim Bong Sik and Kim Sang Sook
Purchase Details
Closed on
May 4, 1995
Sold by
Kim Bong Sik and Kim Sang Sook
Bought by
Kim Bong Sik and Kim Sang Sook
Create a Home Valuation Report for This Property
The Home Valuation Report is an in-depth analysis detailing your home's value as well as a comparison with similar homes in the area
Home Values in the Area
Average Home Value in this Area
Purchase History
| Date | Buyer | Sale Price | Title Company |
|---|---|---|---|
| Kim Bong Sik | -- | None Available | |
| Kim Bong Sik | -- | None Available | |
| Kim Bong Sik | -- | -- |
Source: Public Records
Tax History Compared to Growth
Tax History
| Year | Tax Paid | Tax Assessment Tax Assessment Total Assessment is a certain percentage of the fair market value that is determined by local assessors to be the total taxable value of land and additions on the property. | Land | Improvement |
|---|---|---|---|---|
| 2025 | $2,975 | $190,889 | $34,845 | $156,044 |
| 2024 | $2,975 | $187,147 | $34,162 | $152,985 |
| 2023 | $2,791 | $183,479 | $33,493 | $149,986 |
| 2022 | $2,729 | $179,883 | $32,837 | $147,046 |
| 2021 | $2,672 | $176,357 | $32,194 | $144,163 |
| 2019 | $2,597 | $171,128 | $31,240 | $139,888 |
| 2018 | $2,432 | $167,774 | $30,628 | $137,146 |
| 2016 | $2,318 | $161,261 | $29,440 | $131,821 |
| 2015 | $2,283 | $158,839 | $28,998 | $129,841 |
| 2014 | $2,287 | $155,728 | $28,430 | $127,298 |
Source: Public Records
Map
Nearby Homes
- 2402 Pepperdale Dr
- 2350 Robert Rd
- 2366 Pepperdale Dr
- 19519 Greenwillow Ln
- 2189 Wind River Ln
- 2251 Cascade Way
- 2147 Wind River Ln
- 2124 Camwood Ave
- 2360 Oakleaf Canyon Rd
- 2446 Hillman Ln
- 2545 Brea Canyon Cut Off Rd
- 19173 Hastings St
- 1919 Brea Canyon Cut-Off Rd
- 1943 Arcdale Ave
- 20374 Bickford Dr
- 20374 Portside Dr
- 2572 Carlton Place
- 20456 Holcroft Dr
- 2517 Windsor Place
- 20454 Sartell Dr
- 2459 Clay Ct
- 2464 Clay Ct
- 2484 Coraview Ln
- 2455 Clay Ct
- 2476 Coraview Ln
- 2468 Coraview Ln
- 2455 Pamela Ln
- 19845 Orion Ct
- 2447 Clay Ct
- 2461 Pamela Ln
- 2490 Coraview Ln
- 2445 Pamela Ln
- 19841 Orion Ct
- 2460 Coraview Ln
- 19837 Orion Ct
- 2439 Clay Ct
- 19919 Carolyn Place
- 2479 Coraview Ln
- 2491 Coraview Ln
- 2471 Coraview Ln