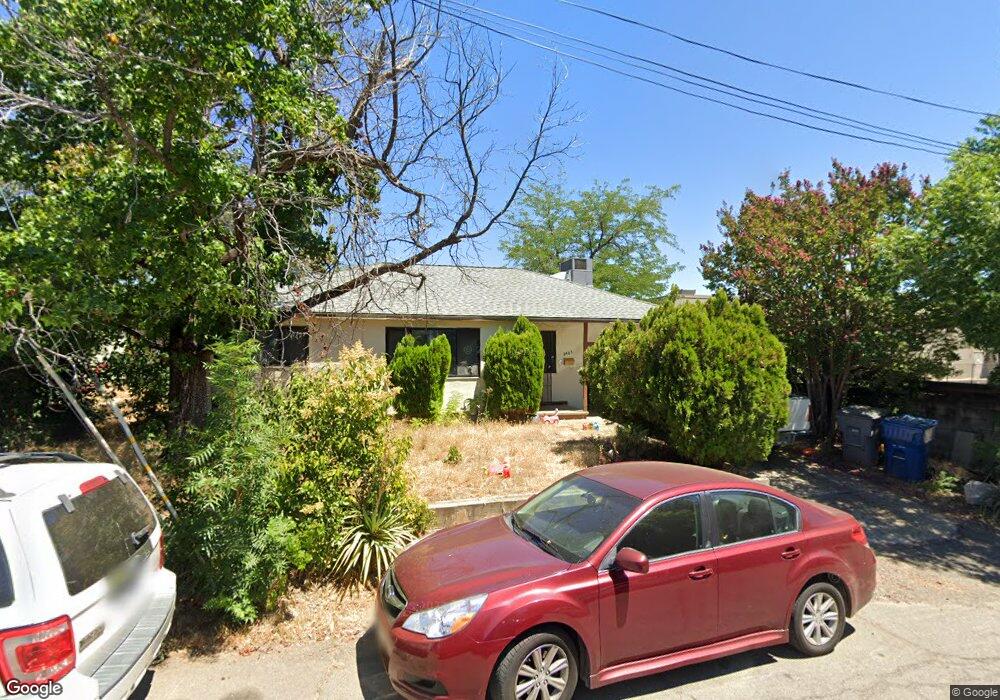
2463 Ramona Place Unit 1 Redding, CA 96002
Bechelli NeighborhoodEstimated Value: $206,000 - $295,106
3
Beds
1
Bath
1,000
Sq Ft
$265/Sq Ft
Est. Value
About This Home
This home is located at 2463 Ramona Place Unit 1, Redding, CA 96002 and is currently estimated at $265,027, approximately $265 per square foot. 2463 Ramona Place Unit 1 is a home located in Shasta County with nearby schools including Rother Elementary School, Parsons Junior High School, and Enterprise High School.
Ownership History
Date
Name
Owned For
Owner Type
Purchase Details
Closed on
Mar 9, 2020
Sold by
Grant Blake T
Bought by
Grant Blake T
Current Estimated Value
Home Financials for this Owner
Home Financials are based on the most recent Mortgage that was taken out on this home.
Original Mortgage
$103,500
Outstanding Balance
$91,816
Interest Rate
3.7%
Mortgage Type
New Conventional
Estimated Equity
$173,211
Purchase Details
Closed on
Jan 27, 2020
Sold by
Grant Sarah
Bought by
Grant Blake T
Home Financials for this Owner
Home Financials are based on the most recent Mortgage that was taken out on this home.
Original Mortgage
$103,500
Outstanding Balance
$91,816
Interest Rate
3.7%
Mortgage Type
New Conventional
Estimated Equity
$173,211
Purchase Details
Closed on
Mar 1, 2007
Sold by
Cheso Paul J
Bought by
Cheso Paul J
Purchase Details
Closed on
May 10, 2006
Sold by
Cheso George
Bought by
Cheso George
Create a Home Valuation Report for This Property
The Home Valuation Report is an in-depth analysis detailing your home's value as well as a comparison with similar homes in the area
Home Values in the Area
Average Home Value in this Area
Purchase History
| Date | Buyer | Sale Price | Title Company |
|---|---|---|---|
| Grant Blake T | -- | None Available | |
| Grant Blake T | -- | Placer Title Company | |
| Grant Blake T | $138,000 | Placer Title Company | |
| Cheso Paul J | -- | None Available | |
| Cheso George | -- | None Available |
Source: Public Records
Mortgage History
| Date | Status | Borrower | Loan Amount |
|---|---|---|---|
| Open | Grant Blake T | $103,500 |
Source: Public Records
Tax History
| Year | Tax Paid | Tax Assessment Tax Assessment Total Assessment is a certain percentage of the fair market value that is determined by local assessors to be the total taxable value of land and additions on the property. | Land | Improvement |
|---|---|---|---|---|
| 2025 | $1,660 | $150,918 | $43,743 | $107,175 |
| 2024 | $1,636 | $147,960 | $42,886 | $105,074 |
| 2023 | $1,636 | $145,060 | $42,046 | $103,014 |
| 2022 | $1,590 | $142,217 | $41,222 | $100,995 |
| 2021 | $1,536 | $139,429 | $40,414 | $99,015 |
| 2020 | $873 | $77,352 | $29,117 | $48,235 |
| 2019 | $866 | $75,837 | $28,547 | $47,290 |
| 2018 | $856 | $74,351 | $27,988 | $46,363 |
| 2017 | $870 | $72,894 | $27,440 | $45,454 |
| 2016 | $815 | $71,465 | $26,902 | $44,563 |
| 2015 | $808 | $70,392 | $26,498 | $43,894 |
| 2014 | $802 | $69,014 | $25,979 | $43,035 |
Source: Public Records
Map
Nearby Homes
- 2935 Shotwick Trail
- 2861 Shotwick Trail
- 2590 Henderson Rd
- 890 Parsons Dr
- 3081 Henderson Rd
- 3140 C St
- 0 Churn Creek Rd Unit 25-496
- 0 Churn Creek Rd Unit 26-609
- 3087 Northwoods Way
- 1968 Bechelli Ln
- 1108 4th St
- 1928 Bechelli Ln
- 350 Park Marina Cir
- 1005 Grissom Ct
- 1075 Le Brun Ln
- 2631 Alfreda Way
- 2820 Alfreda Way
- 2893 Alfreda Way
- 1091 Del Sol Place
- 3540 Ricardo Ave
- 2463 Ramona Place
- 2453 Ramona Place
- 2636 Bechelli Ln
- 2650 Bechelli Ln
- 2443 Ramona Place
- 2668 Bechelli Ln
- 2672 Bechelli Ln
- 2640 Bechelli Ln
- 2680 Bechelli Ln
- 2676 Bechelli Ln
- 2433 Ramona Place
- 2610 Bechelli Ln
- 2464 1 2 Ramona and 2464
- 2464 Ramona Place Unit 2464 1/2
- 2464 Ramona Place
- 2610 Bechelli Ln Unit G and H
- 2454 Ramona Place
- 2444 Ramona Place
- 2423 Ramona Place
- 2423 Ramona Place
Your Personal Tour Guide
Ask me questions while you tour the home.