Estimated Value: $388,000 - $404,575
5
Beds
2
Baths
2,100
Sq Ft
$188/Sq Ft
Est. Value
About This Home
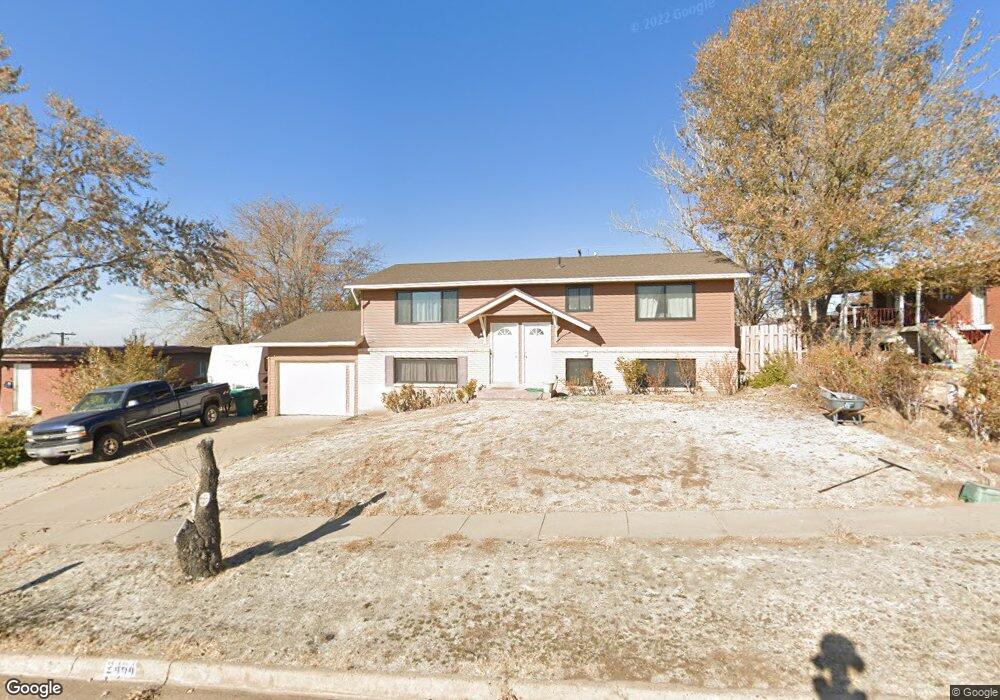
This home is located at 2464 W 5175 S, Roy, UT 84067 and is currently estimated at $395,394, approximately $188 per square foot. 2464 W 5175 S is a home located in Weber County with nearby schools including Lakeview Elementary School, Roy Junior High School, and Roy High School.
Ownership History
Date
Name
Owned For
Owner Type
Purchase Details
Closed on
Oct 30, 2009
Sold by
Arvizu Juan and Arvizu Melissa
Bought by
Baker Adam G and Baker Ashley J
Current Estimated Value
Home Financials for this Owner
Home Financials are based on the most recent Mortgage that was taken out on this home.
Original Mortgage
$132,456
Outstanding Balance
$86,489
Interest Rate
5%
Mortgage Type
FHA
Estimated Equity
$308,905
Purchase Details
Closed on
Sep 13, 2006
Sold by
Putnam Jerry
Bought by
Arvizu Juan and Arvizu Melissa
Home Financials for this Owner
Home Financials are based on the most recent Mortgage that was taken out on this home.
Original Mortgage
$112,500
Interest Rate
6.56%
Mortgage Type
Seller Take Back
Purchase Details
Closed on
Dec 12, 2002
Sold by
Putnam Francis and Putnam Fay
Bought by
Putnam Jerry
Purchase Details
Closed on
Apr 15, 2002
Sold by
Bowman Peggy A
Bought by
Putnam Francis and Putnam Fay
Create a Home Valuation Report for This Property
The Home Valuation Report is an in-depth analysis detailing your home's value as well as a comparison with similar homes in the area
Home Values in the Area
Average Home Value in this Area
Purchase History
We collect this data history from publicly available records. To have your information removed, we recommend requesting removal directly through your county’s website.
| Date | Buyer | Sale Price | Title Company |
|---|---|---|---|
| Baker Adam G | -- | Highland Title | |
| Arvizu Juan | -- | None Available | |
| Putnam Jerry | -- | First American | |
| Putnam Francis | -- | First American Title |
Source: Public Records
Mortgage History
We collect this data history from publicly available records. To have your information removed, we recommend requesting removal directly through your county’s website.
| Date | Status | Borrower | Loan Amount |
|---|---|---|---|
| Open | Baker Adam G | $132,456 | |
| Previous Owner | Arvizu Juan | $112,500 |
Source: Public Records
Tax History
| Year | Tax Paid | Tax Assessment Tax Assessment Total Assessment is a certain percentage of the fair market value that is determined by local assessors to be the total taxable value of land and additions on the property. | Land | Improvement |
|---|---|---|---|---|
| 2025 | $2,281 | $354,388 | $122,630 | $231,758 |
| 2024 | $2,173 | $186,449 | $67,447 | $119,002 |
| 2023 | $2,178 | $188,100 | $64,239 | $123,861 |
| 2022 | $2,398 | $215,600 | $58,643 | $156,957 |
| 2021 | $1,793 | $261,000 | $71,154 | $189,846 |
| 2020 | $1,702 | $228,000 | $71,154 | $156,846 |
| 2019 | $1,776 | $226,000 | $40,998 | $185,002 |
| 2018 | $1,608 | $191,000 | $37,911 | $153,089 |
| 2017 | $1,474 | $163,000 | $37,911 | $125,089 |
| 2016 | $1,469 | $87,729 | $19,302 | $68,427 |
| 2015 | $1,342 | $81,653 | $19,302 | $62,351 |
| 2014 | $1,271 | $75,926 | $16,433 | $59,493 |
Source: Public Records
Map
Nearby Homes
Your Personal Tour Guide
Ask me questions while you tour the home.