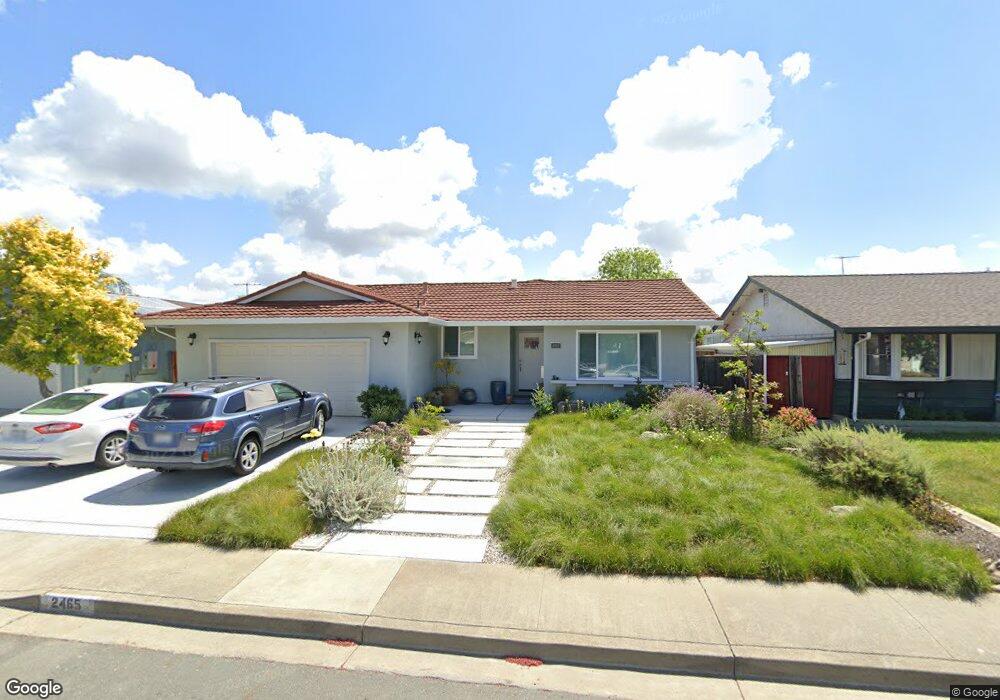
2465 Claremont Place Union City, CA 94587
Estimated Value: $1,448,112 - $1,543,000
4
Beds
2
Baths
1,888
Sq Ft
$787/Sq Ft
Est. Value
About This Home
This home is located at 2465 Claremont Place, Union City, CA 94587 and is currently estimated at $1,485,278, approximately $786 per square foot. 2465 Claremont Place is a home located in Alameda County with nearby schools including Tom Kitayama Elementary School, Itliong-Vera Cruz, and James Logan High School.
Ownership History
Date
Name
Owned For
Owner Type
Purchase Details
Closed on
Aug 10, 2016
Sold by
Nguyen Linh Ngoc Thuy and Kinsiey William J
Bought by
Kinsley William J and Nguyen Linh Ngoc Thuy
Current Estimated Value
Home Financials for this Owner
Home Financials are based on the most recent Mortgage that was taken out on this home.
Original Mortgage
$327,500
Outstanding Balance
$149,412
Interest Rate
3.41%
Mortgage Type
New Conventional
Estimated Equity
$1,335,866
Purchase Details
Closed on
Mar 24, 2014
Sold by
Nguyen Lan Ngoc and Quach Phuc H
Bought by
Nguyen Linh Ngoc Thuy and Kinsley William J
Purchase Details
Closed on
May 7, 2012
Sold by
Nguyen Lan Ngoc and Quach Phuc H
Bought by
Nguyen Lan Ngoc and Quach Phuc H
Purchase Details
Closed on
May 25, 2011
Sold by
Nguyen Lan Ngoc and Quach Phuc H
Bought by
Nguyen Lan Ngoc and Quach Phuc H
Purchase Details
Closed on
May 3, 2004
Sold by
Nguyen Lan Ngoc and Quach Phuc H
Bought by
Nguyen Lan Ngoc and Quach Phuc H
Purchase Details
Closed on
Nov 6, 1995
Sold by
Sbragia Donald M and Sbragia Betty L
Bought by
Vo Dung and Quach Phu
Home Financials for this Owner
Home Financials are based on the most recent Mortgage that was taken out on this home.
Original Mortgage
$180,000
Interest Rate
7.62%
Create a Home Valuation Report for This Property
The Home Valuation Report is an in-depth analysis detailing your home's value as well as a comparison with similar homes in the area
Home Values in the Area
Average Home Value in this Area
Purchase History
| Date | Buyer | Sale Price | Title Company |
|---|---|---|---|
| Kinsley William J | -- | Wfg Nional Title Insurance | |
| Nguyen Linh Ngoc Thuy | -- | None Available | |
| Nguyen Lan Ngoc | -- | None Available | |
| Nguyen Lan Ngoc | -- | None Available | |
| Nguyen Lan Ngoc | -- | -- | |
| Vo Dung | $225,000 | American Title Ins Co |
Source: Public Records
Mortgage History
| Date | Status | Borrower | Loan Amount |
|---|---|---|---|
| Open | Kinsley William J | $327,500 | |
| Previous Owner | Vo Dung | $180,000 |
Source: Public Records
Tax History Compared to Growth
Tax History
| Year | Tax Paid | Tax Assessment Tax Assessment Total Assessment is a certain percentage of the fair market value that is determined by local assessors to be the total taxable value of land and additions on the property. | Land | Improvement |
|---|---|---|---|---|
| 2025 | $6,172 | $375,991 | $112,128 | $263,863 |
| 2024 | $6,172 | $368,619 | $109,929 | $258,690 |
| 2023 | $5,940 | $361,392 | $107,774 | $253,618 |
| 2022 | $5,817 | $354,307 | $105,661 | $248,646 |
| 2021 | $5,688 | $347,361 | $103,590 | $243,771 |
| 2020 | $5,602 | $343,801 | $102,528 | $241,273 |
| 2019 | $5,644 | $337,060 | $100,518 | $236,542 |
| 2018 | $5,486 | $328,492 | $98,547 | $229,945 |
| 2017 | $5,354 | $322,053 | $96,616 | $225,437 |
| 2016 | $5,163 | $315,740 | $94,722 | $221,018 |
| 2015 | $5,061 | $310,998 | $93,299 | $217,699 |
| 2014 | $4,873 | $304,908 | $91,472 | $213,436 |
Source: Public Records
Map
Nearby Homes
- 2469 Ascot Way
- 32226 Crest Ln
- 32333 Crest Ln
- 2544 Franklin Ave Unit 172
- 2572 Parkside Dr
- 32625 Brenda Way Unit 1
- 5375 Singh Cir
- 5325 Singh Cir
- 32613 Singh Cir
- 3178 Santa Marta Ct
- 2955 Risdon Dr Unit 88
- 3142 Sugar Beet Way
- 3058 Flint St Unit 40
- 167 Kona Cir
- 2716 Killdeer Ct
- 3501 Lake Ontario Dr
- 3305 San Carlos Way
- 33010 Lake Mead Dr
- 192 Hawaii Cir
- 30651 Carr Way
- 2467 Claremont Place
- 2463 Claremont Place
- 2460 Andover Dr
- 2462 Andover Dr
- 2458 Andover Dr
- 2461 Claremont Place
- 2469 Claremont Place
- 2466 Claremont Place
- 2464 Andover Dr
- 2464 Claremont Place
- 2468 Claremont Place
- 2456 Andover Dr
- 2471 Claremont Place
- 2462 Claremont Place
- 2470 Claremont Place
- 2459 Claremont Place
- 2466 Andover Dr
- 2454 Andover Dr
- 2472 Claremont Place
- 2460 Claremont Place