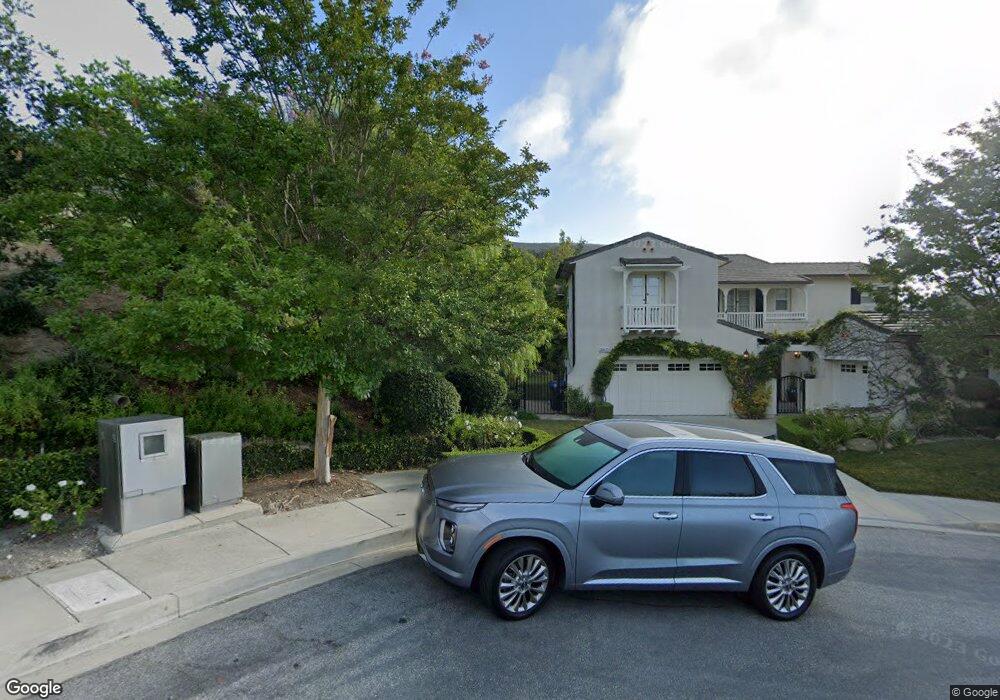
2465 Seacrest Ct Thousand Oaks, CA 91362
Estimated Value: $1,701,000 - $1,842,000
4
Beds
5
Baths
3,566
Sq Ft
$494/Sq Ft
Est. Value
About This Home
This home is located at 2465 Seacrest Ct, Thousand Oaks, CA 91362 and is currently estimated at $1,760,149, approximately $493 per square foot. 2465 Seacrest Ct is a home located in Ventura County with nearby schools including Ladera Stars Academy, Los Cerritos Middle School, and Thousand Oaks High School.
Ownership History
Date
Name
Owned For
Owner Type
Purchase Details
Closed on
Jun 4, 2021
Sold by
Kuchan Leslie Ledezzma
Bought by
Kuchan Vladimir A
Current Estimated Value
Home Financials for this Owner
Home Financials are based on the most recent Mortgage that was taken out on this home.
Original Mortgage
$1,095,000
Outstanding Balance
$987,057
Interest Rate
2.9%
Mortgage Type
Stand Alone Second
Estimated Equity
$773,092
Purchase Details
Closed on
Sep 18, 2014
Sold by
Kuchan Vladimir A and Kuchan Tricia L
Bought by
Kuchan Vladimir A
Purchase Details
Closed on
Mar 1, 2000
Sold by
Sunset Ridge Llc
Bought by
Kuchan Vladimir A and Kuchan Tricia L
Home Financials for this Owner
Home Financials are based on the most recent Mortgage that was taken out on this home.
Original Mortgage
$500,000
Interest Rate
8.34%
Mortgage Type
Stand Alone First
Create a Home Valuation Report for This Property
The Home Valuation Report is an in-depth analysis detailing your home's value as well as a comparison with similar homes in the area
Home Values in the Area
Average Home Value in this Area
Purchase History
| Date | Buyer | Sale Price | Title Company |
|---|---|---|---|
| Kuchan Vladimir A | -- | Chicago Title Company | |
| Kuchan Vladimir A | -- | Chicago Title Company | |
| Kuchan Vladimir A | -- | None Available | |
| Kuchan Vladimir A | $628,000 | Chicago Title Co |
Source: Public Records
Mortgage History
| Date | Status | Borrower | Loan Amount |
|---|---|---|---|
| Open | Kuchan Vladimir A | $1,095,000 | |
| Closed | Kuchan Vladimir A | $500,000 |
Source: Public Records
Tax History Compared to Growth
Tax History
| Year | Tax Paid | Tax Assessment Tax Assessment Total Assessment is a certain percentage of the fair market value that is determined by local assessors to be the total taxable value of land and additions on the property. | Land | Improvement |
|---|---|---|---|---|
| 2025 | $10,549 | $964,731 | $385,888 | $578,843 |
| 2024 | $10,549 | $945,815 | $378,321 | $567,494 |
| 2023 | $10,252 | $927,270 | $370,903 | $556,367 |
| 2022 | $10,068 | $909,089 | $363,631 | $545,458 |
| 2021 | $9,888 | $891,264 | $356,501 | $534,763 |
| 2020 | $9,403 | $882,128 | $352,847 | $529,281 |
| 2019 | $9,150 | $864,832 | $345,929 | $518,903 |
| 2018 | $8,961 | $847,876 | $339,147 | $508,729 |
| 2017 | $8,785 | $831,252 | $332,498 | $498,754 |
| 2016 | $8,701 | $814,954 | $325,979 | $488,975 |
| 2015 | $8,548 | $802,715 | $321,084 | $481,631 |
| 2014 | $8,420 | $786,994 | $314,796 | $472,198 |
Source: Public Records
Map
Nearby Homes
- 2427 Springbrook St
- 3249 Springbrook St
- 2499 Springbrook St
- 2347 Laurelwood Dr
- 2906 Evesham Ave
- 2848 Bayham Cir
- 2217 Laurelwood Dr
- 2996 Eagles Claw Ave
- 3225 Futura Point
- 2827 Arbella Ln
- 3128 Casino Dr
- 2780 Blazing Star Dr
- 3822 Sunset Knolls Dr
- 3178 Sunset Hills Blvd
- 3375 Montagne Way
- 1915 Woodside Dr
- 3194 Sunset Hills Blvd
- 2001 Brookfield Dr
- 2724 Capella Way
- 2481 Seacrest Ct
- 3295 Windmist Ave
- 2489 Seacrest Ct
- 2464 Seacrest Ct
- 2472 Seacrest Ct
- 2480 Seacrest Ct
- 2488 Seacrest Ct
- 3283 Windmist Ave
- 3271 Windmist Ave
- 2496 Seacrest Ct
- 2435 Springbrook St
- 2443 Springbrook St
- 2451 Springbrook St
- 3259 Windmist Ave
- 2415 Springbrook St
- 3294 Windmist Ave
- 2475 Springbrook St
- 3282 Windmist Ave
- 2487 Springbrook St
- 3270 Windmist Ave