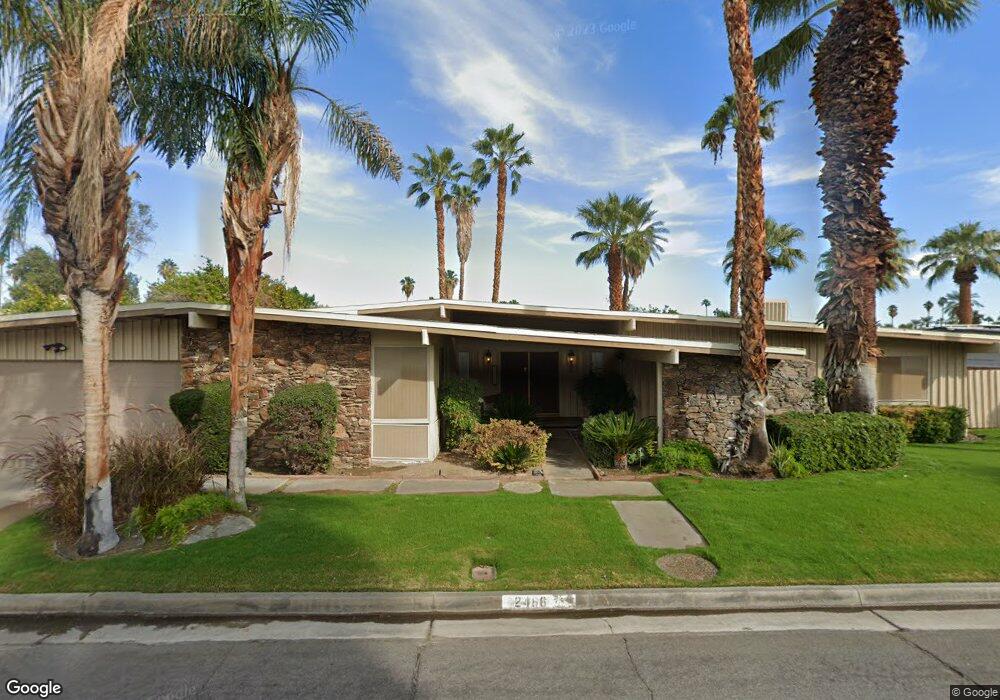
2466 S Pebble Beach Dr Palm Springs, CA 92264
Estimated Value: $944,000 - $1,245,000
3
Beds
2
Baths
2,222
Sq Ft
$476/Sq Ft
Est. Value
About This Home
This home is located at 2466 S Pebble Beach Dr, Palm Springs, CA 92264 and is currently estimated at $1,057,810, approximately $476 per square foot. 2466 S Pebble Beach Dr is a home located in Riverside County with nearby schools including Cahuilla Elementary School, Raymond Cree Middle School, and Palm Springs High School.
Ownership History
Date
Name
Owned For
Owner Type
Purchase Details
Closed on
Mar 6, 2025
Sold by
Strebin William B and Strebin Sharon K
Bought by
W S Strebin Family Trust and Strebin
Current Estimated Value
Purchase Details
Closed on
Jun 17, 1999
Sold by
Groesbeck Richard G
Bought by
Strebin William B and Strebin Sharon K
Home Financials for this Owner
Home Financials are based on the most recent Mortgage that was taken out on this home.
Original Mortgage
$187,200
Interest Rate
7.37%
Mortgage Type
Purchase Money Mortgage
Purchase Details
Closed on
Jun 12, 1999
Sold by
Darla Groesbeck
Bought by
Groesbeck Richard Gordon
Home Financials for this Owner
Home Financials are based on the most recent Mortgage that was taken out on this home.
Original Mortgage
$187,200
Interest Rate
7.37%
Mortgage Type
Purchase Money Mortgage
Create a Home Valuation Report for This Property
The Home Valuation Report is an in-depth analysis detailing your home's value as well as a comparison with similar homes in the area
Home Values in the Area
Average Home Value in this Area
Purchase History
| Date | Buyer | Sale Price | Title Company |
|---|---|---|---|
| W S Strebin Family Trust | -- | None Listed On Document | |
| Strebin William B | $234,000 | Chicago Title Co | |
| Groesbeck Richard Gordon | -- | Chicago Title Co |
Source: Public Records
Mortgage History
| Date | Status | Borrower | Loan Amount |
|---|---|---|---|
| Previous Owner | Strebin William B | $187,200 |
Source: Public Records
Tax History Compared to Growth
Tax History
| Year | Tax Paid | Tax Assessment Tax Assessment Total Assessment is a certain percentage of the fair market value that is determined by local assessors to be the total taxable value of land and additions on the property. | Land | Improvement |
|---|---|---|---|---|
| 2025 | $4,317 | $339,641 | $92,203 | $247,438 |
| 2023 | $4,317 | $326,455 | $88,624 | $237,831 |
| 2022 | $4,401 | $320,055 | $86,887 | $233,168 |
| 2021 | $4,315 | $313,781 | $85,184 | $228,597 |
| 2020 | $4,127 | $310,565 | $84,311 | $226,254 |
| 2019 | $4,058 | $304,476 | $82,658 | $221,818 |
| 2018 | $3,984 | $298,507 | $81,039 | $217,468 |
| 2017 | $3,927 | $292,654 | $79,450 | $213,204 |
| 2016 | $3,815 | $286,917 | $77,893 | $209,024 |
| 2015 | $3,657 | $282,609 | $76,724 | $205,885 |
| 2014 | $3,605 | $277,075 | $75,222 | $201,853 |
Source: Public Records
Map
Nearby Homes
- 5300 Los Coyotes Dr
- 2303 Los Patos Dr
- 5240 E Lakeside Dr
- 2306 Los Patos Dr
- 2176 S Bobolink Ln
- 5723 Los Coyotes Dr
- 2201 Los Patos Dr
- 2088 S Pebble Beach Dr
- 5300 E Waverly Dr Unit A4
- 5300 E Waverly Dr Unit K7
- 5300 E Waverly Dr Unit F11
- 5300 E Waverly Dr Unit C13
- 5111 E Bobolink Ln
- 2178 S Brentwood Dr
- 2700 Lawrence Crossley Rd Unit 90
- 2700 Lawrence Crossley Rd Unit 37
- 2700 Lawrence Crossley Rd Unit 83
- 2700 Lawrence Crossley Rd Unit 65
- 2700 Lawrence Crossley Rd Unit 52
- 2700 Lawrence Crossley Rd Unit 103
- 2424 S Pebble Beach Dr
- 2478 S Pebble Beach Dr
- 2455 S Pebble Beach Dr Unit 73
- 2395 S Pebble Beach Dr
- 2376 S Pebble Beach Dr
- 2484 S Pebble Beach Dr
- 5401 E Lakeside Dr
- 5366 E Lakeside Dr
- 2373 S Pebble Beach Dr
- 2373 S Pebble Beach Dr
- 5369 E Lakeside Dr
- 2355 S Pebble Beach Dr
- 5342 E Lakeside Dr
- 5342 E Lakeside Dr
- 5355 E Lakeside Dr
- 2326 S Pebble Beach Dr
- 2309 S Pebble Beach Dr
- 5330 E Lakeside Dr
- 5337 E Lakeside Dr
- 2284 S Pebble Beach Dr