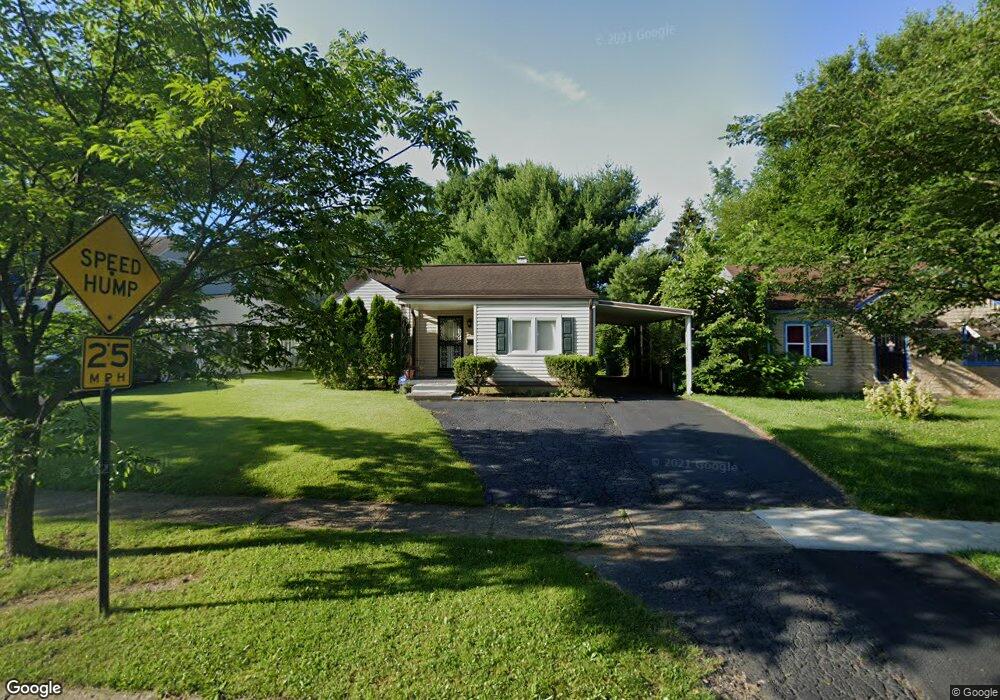
2467 Argyle Dr Columbus, OH 43219
Brittany Hills NeighborhoodEstimated Value: $134,000 - $152,000
2
Beds
1
Bath
872
Sq Ft
$162/Sq Ft
Est. Value
About This Home
This home is located at 2467 Argyle Dr, Columbus, OH 43219 and is currently estimated at $140,917, approximately $161 per square foot. 2467 Argyle Dr is a home located in Franklin County with nearby schools including South Mifflin Stem Academy (K-6), Linden-Mckinley Stem School On Arcadia, and Cesar Chavez College Preparatory School.
Ownership History
Date
Name
Owned For
Owner Type
Purchase Details
Closed on
Oct 31, 2003
Sold by
Dumar Associates Ltd
Bought by
Powell John G
Current Estimated Value
Home Financials for this Owner
Home Financials are based on the most recent Mortgage that was taken out on this home.
Original Mortgage
$72,511
Outstanding Balance
$32,588
Interest Rate
6.02%
Mortgage Type
FHA
Estimated Equity
$108,329
Purchase Details
Closed on
May 9, 2002
Sold by
Valentine Harold and Estate Of Anna M Johns
Bought by
Dumar Associates Ltd
Purchase Details
Closed on
Dec 31, 2000
Sold by
Valentine Harold
Bought by
A L C A Llc
Home Financials for this Owner
Home Financials are based on the most recent Mortgage that was taken out on this home.
Original Mortgage
$41,000
Interest Rate
10%
Mortgage Type
Seller Take Back
Purchase Details
Closed on
Jan 29, 1993
Bought by
Johns Anna M
Create a Home Valuation Report for This Property
The Home Valuation Report is an in-depth analysis detailing your home's value as well as a comparison with similar homes in the area
Home Values in the Area
Average Home Value in this Area
Purchase History
| Date | Buyer | Sale Price | Title Company |
|---|---|---|---|
| Powell John G | $73,100 | -- | |
| Dumar Associates Ltd | $44,000 | -- | |
| A L C A Llc | $41,000 | -- | |
| Johns Anna M | -- | -- |
Source: Public Records
Mortgage History
| Date | Status | Borrower | Loan Amount |
|---|---|---|---|
| Open | Powell John G | $72,511 | |
| Previous Owner | A L C A Llc | $41,000 |
Source: Public Records
Tax History
| Year | Tax Paid | Tax Assessment Tax Assessment Total Assessment is a certain percentage of the fair market value that is determined by local assessors to be the total taxable value of land and additions on the property. | Land | Improvement |
|---|---|---|---|---|
| 2025 | $1,595 | $35,530 | $8,160 | $27,370 |
| 2024 | $1,595 | $35,530 | $8,160 | $27,370 |
| 2023 | $1,574 | $35,530 | $8,160 | $27,370 |
| 2022 | $1,090 | $21,010 | $2,560 | $18,450 |
| 2021 | $1,092 | $21,010 | $2,560 | $18,450 |
| 2020 | $1,093 | $21,010 | $2,560 | $18,450 |
| 2019 | $1,002 | $16,520 | $2,030 | $14,490 |
| 2018 | $1,055 | $16,520 | $2,030 | $14,490 |
| 2017 | $1,002 | $16,520 | $2,030 | $14,490 |
| 2016 | $1,222 | $18,450 | $2,700 | $15,750 |
| 2015 | $1,109 | $18,450 | $2,700 | $15,750 |
| 2014 | $1,112 | $18,450 | $2,700 | $15,750 |
| 2013 | $609 | $20,475 | $2,975 | $17,500 |
Source: Public Records
Map
Nearby Homes
- 2459 Meredith Dr
- 1582 Vendome Dr S
- 2526 Queenswood Dr
- 2144 Toni St
- 2169 Argyle Dr
- 1477 Dove Dr
- 1816 Brentnell Ave
- 2288 Woodward Ave
- 2131 Argyle Dr
- 1331 Woodnell Ave
- 2350 Edenburgh Dr S
- 1245 Brentnell Ave
- 1089 Wellington Blvd
- 2321 Dunning Ct
- 1198 Woodnell Ave
- 1893 Jermain Dr
- 0 Mock Rd
- 2143 Leonard Ave
- 2324 Ridgeway Ave
- 2278 Ridgeway Ave Unit 278
Your Personal Tour Guide
Ask me questions while you tour the home.