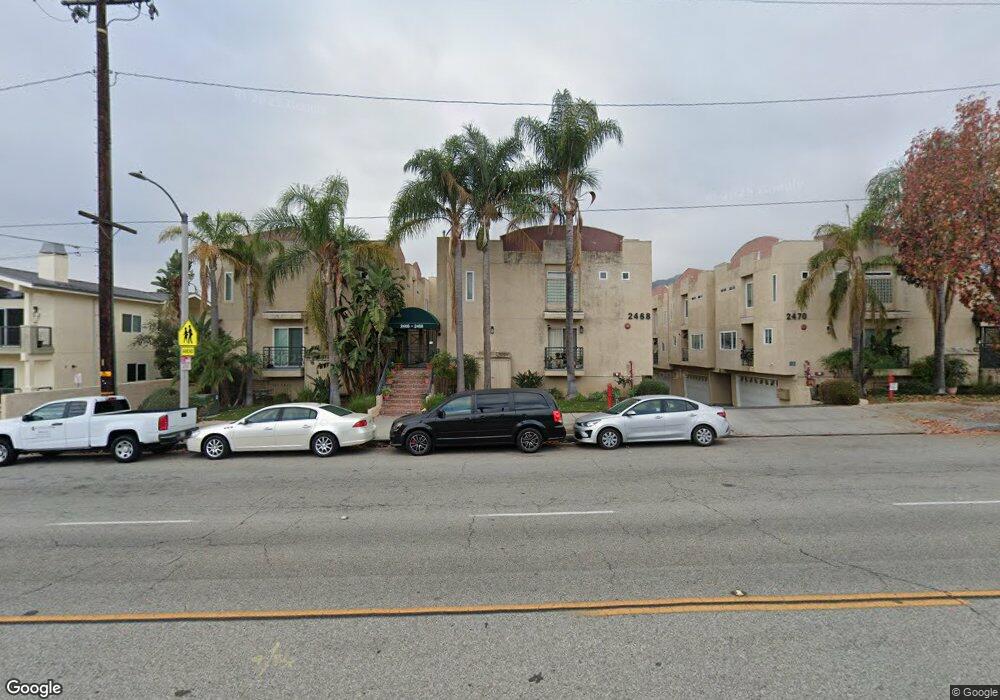
2468 Montrose Ave Unit 5 Montrose, CA 91020
Sparr Heights NeighborhoodEstimated Value: $854,000 - $932,000
3
Beds
3
Baths
1,702
Sq Ft
$524/Sq Ft
Est. Value
About This Home
This home is located at 2468 Montrose Ave Unit 5, Montrose, CA 91020 and is currently estimated at $892,676, approximately $524 per square foot. 2468 Montrose Ave Unit 5 is a home located in Los Angeles County with nearby schools including John C. Fremont Elementary School, Rosemont Middle School, and Crescenta Valley High School.
Ownership History
Date
Name
Owned For
Owner Type
Purchase Details
Closed on
Oct 21, 2010
Sold by
Karayan Rafi
Bought by
Karayan Rafi and Rafi Karayan Revocable Trust
Current Estimated Value
Purchase Details
Closed on
Jul 21, 1999
Sold by
Karayan Karnig and Karayan Angel
Bought by
Karayan Rafi
Purchase Details
Closed on
Dec 22, 1998
Sold by
Federal Home Loan Mortgage Corporation
Bought by
Karayan Karnig and Karayan Angel
Purchase Details
Closed on
Mar 26, 1998
Sold by
Park Soo Bum and Park Young Sook
Bought by
Federal Home Loan Mortgage Corporation
Purchase Details
Closed on
Aug 29, 1995
Sold by
Avenue 2462-2470 Montrose
Bought by
Park Soom Bum and Park Young Sook
Home Financials for this Owner
Home Financials are based on the most recent Mortgage that was taken out on this home.
Original Mortgage
$145,425
Interest Rate
6.75%
Create a Home Valuation Report for This Property
The Home Valuation Report is an in-depth analysis detailing your home's value as well as a comparison with similar homes in the area
Home Values in the Area
Average Home Value in this Area
Purchase History
| Date | Buyer | Sale Price | Title Company |
|---|---|---|---|
| Karayan Rafi | -- | None Available | |
| Karayan Rafi | -- | Gateway Title | |
| Karayan Karnig | $135,000 | First American Title Co | |
| Federal Home Loan Mortgage Corporation | $154,454 | Landsafe Title | |
| Park Soom Bum | $194,000 | First American Title Co |
Source: Public Records
Mortgage History
| Date | Status | Borrower | Loan Amount |
|---|---|---|---|
| Previous Owner | Park Soom Bum | $145,425 | |
| Closed | Park Soom Bum | $29,085 |
Source: Public Records
Tax History Compared to Growth
Tax History
| Year | Tax Paid | Tax Assessment Tax Assessment Total Assessment is a certain percentage of the fair market value that is determined by local assessors to be the total taxable value of land and additions on the property. | Land | Improvement |
|---|---|---|---|---|
| 2025 | $4,044 | $344,876 | $156,761 | $188,115 |
| 2024 | $4,044 | $338,115 | $153,688 | $184,427 |
| 2023 | $3,956 | $331,486 | $150,675 | $180,811 |
| 2022 | $3,825 | $324,987 | $147,721 | $177,266 |
| 2021 | $3,753 | $318,616 | $144,825 | $173,791 |
| 2019 | $3,613 | $309,167 | $140,530 | $168,637 |
| 2018 | $3,542 | $303,106 | $137,775 | $165,331 |
| 2016 | $3,366 | $291,338 | $132,426 | $158,912 |
| 2015 | $3,291 | $286,962 | $130,437 | $156,525 |
| 2014 | $3,268 | $281,341 | $127,882 | $153,459 |
Source: Public Records
Map
Nearby Homes
- 2468 Montrose Ave Unit 6
- 2522 Fairway Ave
- 4326 Briggs Ave
- 2710 Piedmont Ave Unit 21
- 2434 Prospect Ave
- 2249 Montrose Ave Unit 7
- 4328 Sunset Ave
- 3658 Sierra Vista Ave
- 2222 Montrose Ave Unit G
- 2512 Prospect Ave
- 3928 La Crescenta Ave
- 2754 Montrose Ave
- 2743 Montrose Ave Unit 110
- 2806 Manhattan Ave
- 3508 Rosemary Ave
- 4133 La Crescenta Ave
- 2817 Montrose Ave
- 2102 La Canada Crest Dr Unit B
- 4430 Rosebank Dr
- 3470 Downing Ave
- 2468 Montrose Ave
- 2468 Montrose Ave Unit B2
- 2468 Montrose Ave Unit C3
- 2468 Montrose Ave Unit 4
- 2468 Montrose Ave Unit 3
- 2468 Montrose Ave Unit 2
- 2468 Montrose Ave Unit 1
- 2454 Montrose Ave
- 2454 Montrose Ave Unit 14
- 2454 Montrose Ave Unit 15
- 2454 Montrose Ave Unit 16
- 2454 Montrose Ave Unit 13
- 2454 Montrose Ave Unit 5
- 2454 Montrose Ave Unit 4
- 2454 Montrose Ave Unit 1
- 2454 Montrose Ave Unit 9
- 2454 Montrose Ave Unit 8
- 2454 Montrose Ave Unit 10
- 2454 Montrose Ave Unit 12
- 2454 Montrose Ave Unit 3