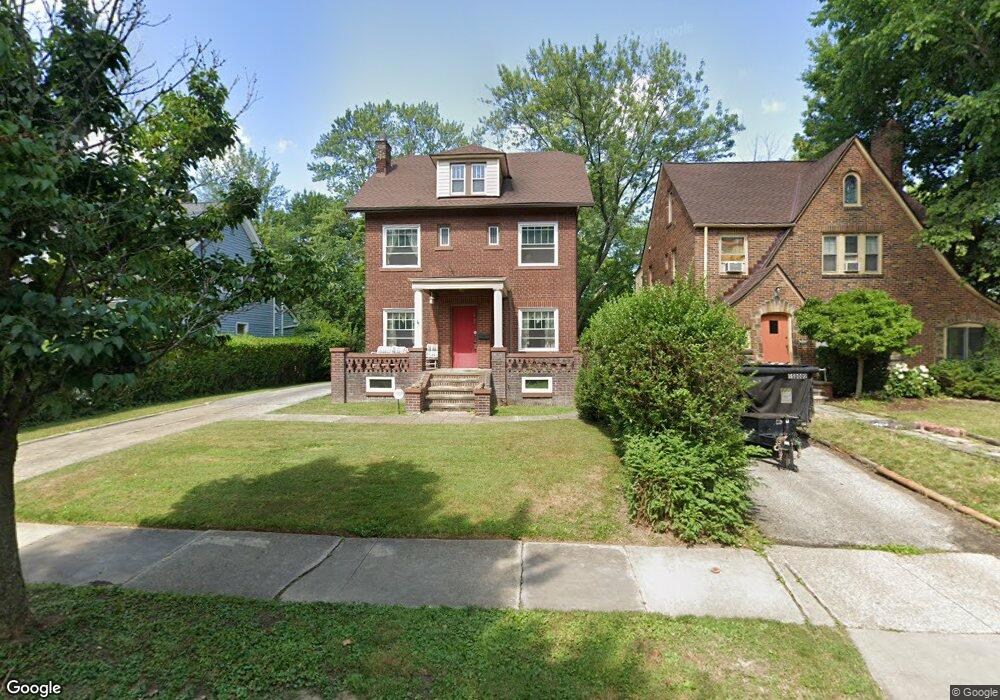
2468 Queenston Rd Cleveland, OH 44118
Estimated Value: $301,000 - $317,000
3
Beds
2
Baths
1,748
Sq Ft
$176/Sq Ft
Est. Value
About This Home
This home is located at 2468 Queenston Rd, Cleveland, OH 44118 and is currently estimated at $306,850, approximately $175 per square foot. 2468 Queenston Rd is a home located in Cuyahoga County with nearby schools including Canterbury Elementary School, Roxboro Middle School, and Cleveland Heights High School.
Ownership History
Date
Name
Owned For
Owner Type
Purchase Details
Closed on
Aug 4, 2010
Sold by
Binder Raymond F
Bought by
Binder Holly
Current Estimated Value
Purchase Details
Closed on
Mar 20, 2007
Sold by
Binder Holly and Hardenbergh Holly E
Bought by
Binder Holly and Binder Raymond F
Home Financials for this Owner
Home Financials are based on the most recent Mortgage that was taken out on this home.
Original Mortgage
$72,400
Outstanding Balance
$44,939
Interest Rate
6.73%
Mortgage Type
New Conventional
Estimated Equity
$261,911
Purchase Details
Closed on
Jul 20, 1993
Sold by
Ohman James C
Bought by
Owens Matthew W
Purchase Details
Closed on
Oct 30, 1987
Sold by
Bolibruch James R
Bought by
Ohman James C
Purchase Details
Closed on
Nov 7, 1979
Sold by
D-Emilia Alfonso and D-Emilia Mary J
Bought by
Bolibruch James R
Purchase Details
Closed on
Jan 1, 1975
Bought by
D-Emilia Alfonso and D-Emilia Mary J
Create a Home Valuation Report for This Property
The Home Valuation Report is an in-depth analysis detailing your home's value as well as a comparison with similar homes in the area
Home Values in the Area
Average Home Value in this Area
Purchase History
| Date | Buyer | Sale Price | Title Company |
|---|---|---|---|
| Binder Holly | -- | None Available | |
| Binder Holly | -- | Accommodation | |
| Owens Matthew W | $107,500 | -- | |
| Ohman James C | $74,900 | -- | |
| Bolibruch James R | $54,000 | -- | |
| D-Emilia Alfonso | -- | -- |
Source: Public Records
Mortgage History
| Date | Status | Borrower | Loan Amount |
|---|---|---|---|
| Open | Binder Holly | $72,400 |
Source: Public Records
Tax History Compared to Growth
Tax History
| Year | Tax Paid | Tax Assessment Tax Assessment Total Assessment is a certain percentage of the fair market value that is determined by local assessors to be the total taxable value of land and additions on the property. | Land | Improvement |
|---|---|---|---|---|
| 2024 | $8,207 | $93,695 | $17,045 | $76,650 |
| 2023 | $6,566 | $60,560 | $12,990 | $47,570 |
| 2022 | $6,533 | $60,550 | $12,990 | $47,570 |
| 2021 | $6,400 | $60,550 | $12,990 | $47,570 |
| 2020 | $6,319 | $54,040 | $11,590 | $42,460 |
| 2019 | $5,968 | $154,400 | $33,100 | $121,300 |
| 2018 | $6,134 | $54,040 | $11,590 | $42,460 |
| 2017 | $6,654 | $56,110 | $11,340 | $44,770 |
| 2016 | $6,641 | $56,110 | $11,340 | $44,770 |
| 2015 | $5,831 | $56,110 | $11,340 | $44,770 |
| 2014 | $5,831 | $51,940 | $10,500 | $41,440 |
Source: Public Records
Map
Nearby Homes
- 3528 Meadowbrook Blvd
- 3366 Clarendon Rd
- 3609 E Scarborough Rd
- 3323 E Fairfax Rd
- 3343 E Scarborough Rd
- 3327 Bradford Rd
- 3311 E Fairfax Rd
- 3333 Ormond Rd
- 3297 E Scarborough Rd
- 2658 Queenston Rd
- 3540 Silsby Rd
- 3485 Silsby Rd
- 2272 S Taylor Rd
- 2423 Eaton Rd
- 3277 E Scarborough Rd
- 3335 Meadowbrook Blvd
- 3705 Meadowbrook Blvd
- 2359 Ashurst Rd
- 3366 Tullamore Rd
- 3383 Tullamore Rd
- 2462 Queenston Rd
- 2472 Queenston Rd
- 2458 Queenston Rd
- 2478 Queenston Rd
- 2452 Queenston Rd
- 2482 Queenston Rd
- 2469 S Taylor Rd
- 2465 S Taylor Rd
- 2448 Queenston Rd
- 2479 S Taylor Rd
- 2459 S Taylor Rd
- 2485 S Taylor Rd
- 2453 S Taylor Rd
- 2444 Queenston Rd
- 2491 S Taylor Rd
- 2447 S Taylor Rd
- 2473 Queenston Rd
- 2463 Queenston Rd
- 2479 Queenston Rd
- 2459 Queenston Rd