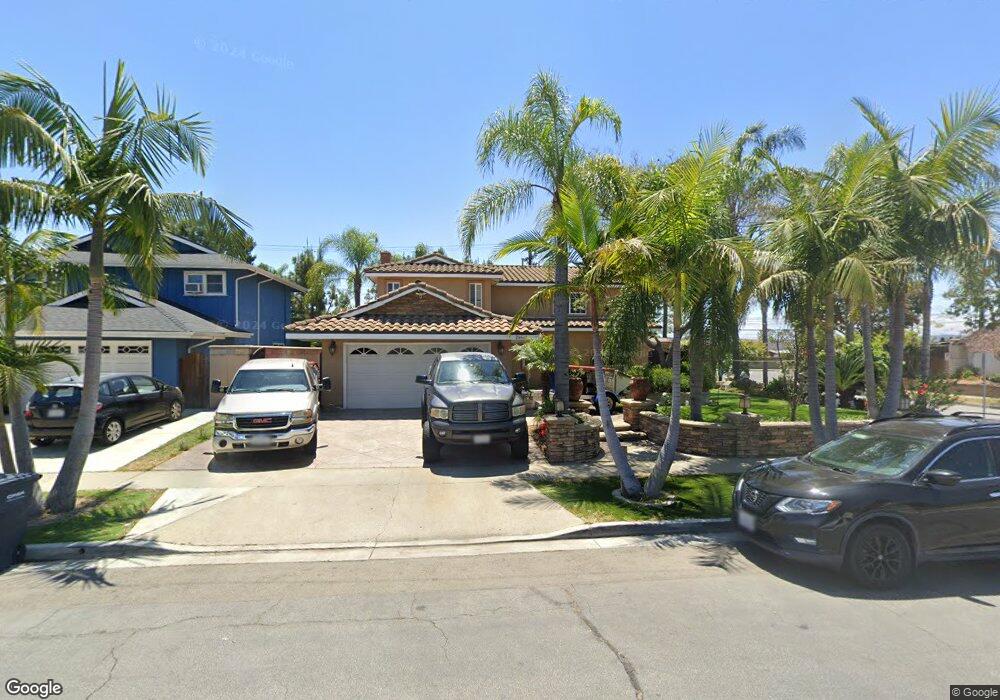
24682 Corta Cresta Dr Lake Forest, CA 92630
Estimated Value: $1,289,000 - $1,886,000
5
Beds
4
Baths
3,423
Sq Ft
$450/Sq Ft
Est. Value
About This Home
This home is located at 24682 Corta Cresta Dr, Lake Forest, CA 92630 and is currently estimated at $1,538,746, approximately $449 per square foot. 24682 Corta Cresta Dr is a home located in Orange County with nearby schools including Olivewood Elementary School, Serrano Intermediate School, and El Toro High School.
Ownership History
Date
Name
Owned For
Owner Type
Purchase Details
Closed on
May 3, 2024
Sold by
Perez Jose Santos
Bought by
Herrera Perez Revocable Living Trust and Perez
Current Estimated Value
Purchase Details
Closed on
Sep 12, 2001
Sold by
Perez Martina
Bought by
Perez Jose Santos
Home Financials for this Owner
Home Financials are based on the most recent Mortgage that was taken out on this home.
Original Mortgage
$227,200
Interest Rate
7%
Purchase Details
Closed on
Aug 3, 1998
Sold by
Nelson Gregory J and Nelson Maria S
Bought by
Ando Tobin K
Home Financials for this Owner
Home Financials are based on the most recent Mortgage that was taken out on this home.
Original Mortgage
$202,980
Interest Rate
6.92%
Mortgage Type
VA
Purchase Details
Closed on
Nov 20, 1995
Sold by
Nelson Gregory J and Nelson Maria Salcido
Bought by
Nelson Gregory J and Salcido Nelson Maria
Create a Home Valuation Report for This Property
The Home Valuation Report is an in-depth analysis detailing your home's value as well as a comparison with similar homes in the area
Home Values in the Area
Average Home Value in this Area
Purchase History
| Date | Buyer | Sale Price | Title Company |
|---|---|---|---|
| Herrera Perez Revocable Living Trust | -- | None Listed On Document | |
| Perez Jose Santos | -- | Southland Title | |
| Perez Jose Santos | $284,000 | Southland Title | |
| Ando Tobin K | $199,000 | Chicago Title Co | |
| Nelson Gregory J | -- | -- |
Source: Public Records
Mortgage History
| Date | Status | Borrower | Loan Amount |
|---|---|---|---|
| Previous Owner | Perez Jose Santos | $227,200 | |
| Previous Owner | Ando Tobin K | $202,980 |
Source: Public Records
Tax History
| Year | Tax Paid | Tax Assessment Tax Assessment Total Assessment is a certain percentage of the fair market value that is determined by local assessors to be the total taxable value of land and additions on the property. | Land | Improvement |
|---|---|---|---|---|
| 2025 | $7,577 | $747,641 | $338,205 | $409,436 |
| 2024 | $7,577 | $732,982 | $331,574 | $401,408 |
| 2023 | $7,398 | $718,610 | $325,072 | $393,538 |
| 2022 | $7,264 | $704,520 | $318,698 | $385,822 |
| 2021 | $7,119 | $690,706 | $312,449 | $378,257 |
| 2020 | $7,054 | $683,624 | $309,245 | $374,379 |
| 2019 | $6,912 | $670,220 | $303,181 | $367,039 |
| 2018 | $6,782 | $657,079 | $297,236 | $359,843 |
| 2017 | $6,645 | $644,196 | $291,408 | $352,788 |
| 2016 | $6,534 | $631,565 | $285,694 | $345,871 |
| 2015 | $6,454 | $622,079 | $281,403 | $340,676 |
| 2014 | $6,313 | $609,894 | $275,891 | $334,003 |
Source: Public Records
Map
Nearby Homes
- 24842 Calle el Toro Grande
- 23372 Dune Mear Rd
- 24741 Calle el Toro Grande
- 23298 Orange Ave Unit#4
- 23216 Orange Ave Unit 6
- 23214 Orange Ave Unit 3
- 23214 Orange Ave Unit 7
- 24922 Muirlands Blvd Unit 91
- 24922 Muirlands Blvd Unit 57
- 24922 Muirlands Blvd Unit 131
- 23224 Orange Ave Unit 5
- 24921 Muirlands Blvd Unit 58
- 24921 Muirlands Blvd Unit 209
- 24921 Muirlands Blvd
- 24921 Muirlands Blvd Unit 48
- 24921 Muirlands Blvd Unit 168
- 24921 Muirlands Blvd Unit 265
- 24921 Muirlands Blvd Unit 63
- 24921 Muirlands Blvd Unit 23
- 24921 Muirlands Blvd Unit 326
- 24692 Corta Cresta Dr
- 24662 Corta Cresta Dr
- 24702 Corta Cresta Dr
- 23202 Tulip St
- 24652 Corta Cresta Dr
- 24712 Corta Cresta Dr
- 24651 Bunbury Dr
- 24661 Bunbury Dr
- 24641 Bunbury Dr
- 23221 La Vaca St
- 23182 Tulip St
- 23191 Tulip St
- 24631 Bunbury Dr
- 24642 Corta Cresta Dr
- 23211 La Vaca St
- 24621 Bunbury Dr
- 24722 Corta Cresta Dr
- 23181 Tulip St
- 23162 El Caballo St
- 23262 La Vaca St
Your Personal Tour Guide
Ask me questions while you tour the home.