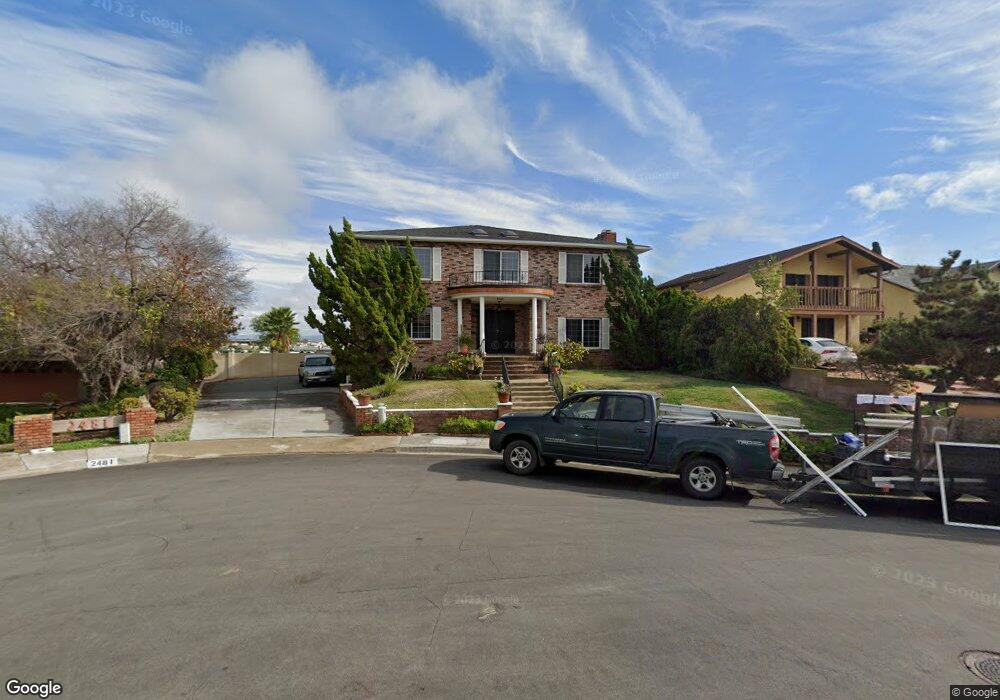
2469 Kathleen Place San Diego, CA 92105
Oak Park NeighborhoodEstimated Value: $864,000 - $1,056,000
4
Beds
3
Baths
3,908
Sq Ft
$246/Sq Ft
Est. Value
About This Home
This home is located at 2469 Kathleen Place, San Diego, CA 92105 and is currently estimated at $962,416, approximately $246 per square foot. 2469 Kathleen Place is a home located in San Diego County with nearby schools including Oak Park Elementary School, Mann Middle School, and Crawford High School.
Ownership History
Date
Name
Owned For
Owner Type
Purchase Details
Closed on
Sep 5, 2018
Sold by
Motley Dehavilland Jean
Bought by
Motley De Havilland J and De Havilland J Motley Trust
Current Estimated Value
Purchase Details
Closed on
Feb 7, 2011
Sold by
Motley Dehavilland Jean
Bought by
Motley Dehavilland Jean
Purchase Details
Closed on
Mar 16, 1994
Sold by
Jenkins Calvin H and Jenkins Olena
Bought by
Jenkins Calvin H and Jenkins Olena
Home Financials for this Owner
Home Financials are based on the most recent Mortgage that was taken out on this home.
Original Mortgage
$120,000
Interest Rate
7.09%
Purchase Details
Closed on
Feb 22, 1994
Sold by
Jenkins Calvin H and Jenkins Olena
Bought by
Jenkins Calvin H and Jenkins Olena
Home Financials for this Owner
Home Financials are based on the most recent Mortgage that was taken out on this home.
Original Mortgage
$120,000
Interest Rate
7.09%
Create a Home Valuation Report for This Property
The Home Valuation Report is an in-depth analysis detailing your home's value as well as a comparison with similar homes in the area
Home Values in the Area
Average Home Value in this Area
Purchase History
| Date | Buyer | Sale Price | Title Company |
|---|---|---|---|
| Motley De Havilland J | -- | None Available | |
| Motley Dehavilland Jean | -- | None Available | |
| Jenkins Calvin H | -- | United Title Company | |
| Jenkins Calvin H | -- | United Title Company |
Source: Public Records
Mortgage History
| Date | Status | Borrower | Loan Amount |
|---|---|---|---|
| Closed | Jenkins Calvin H | $120,000 |
Source: Public Records
Tax History Compared to Growth
Tax History
| Year | Tax Paid | Tax Assessment Tax Assessment Total Assessment is a certain percentage of the fair market value that is determined by local assessors to be the total taxable value of land and additions on the property. | Land | Improvement |
|---|---|---|---|---|
| 2025 | $2,458 | $208,338 | $34,856 | $173,482 |
| 2024 | $2,458 | $204,254 | $34,173 | $170,081 |
| 2023 | $2,401 | $200,250 | $33,503 | $166,747 |
| 2022 | $2,336 | $196,325 | $32,847 | $163,478 |
| 2021 | $2,318 | $192,476 | $32,203 | $160,273 |
| 2020 | $2,290 | $190,503 | $31,873 | $158,630 |
| 2019 | $2,248 | $186,769 | $31,249 | $155,520 |
| 2018 | $2,101 | $183,108 | $30,637 | $152,471 |
| 2017 | $2,049 | $179,519 | $30,037 | $149,482 |
| 2016 | $2,014 | $176,000 | $29,449 | $146,551 |
| 2015 | $1,984 | $173,357 | $29,007 | $144,350 |
| 2014 | $1,952 | $169,962 | $28,439 | $141,523 |
Source: Public Records
Map
Nearby Homes
- 5550 Grape St
- 2003 Bayview Heights Dr Unit SPC 109
- 2003 Bayview Heights Dr Unit SPC 210
- 2003 Bayview Heights Dr Unit 157
- 2003 Bayview Heights Dr Unit SPC 180
- 2003 Bayview Heights Dr Unit 176
- 2003 Bayview Heights Dr Unit 83
- 2003 Bayview Heights Dr Unit 105
- 2151 54th St
- 5989 Chaumont Dr
- 1825 Bayview Heights Dr Unit 97
- 2215 Susan Place
- 5233 Caminito Cachorro
- 1651 Pentecost Way Unit 1
- 1653 Pentecost Way Unit 12
- 1647 Pentecost Way Unit 11
- 1679 Pentecost Way Unit 5
- 2039 Winnett St
- 5610 Streamview Dr
- 5566 Streamview Dr
- 2457 Kathleen Place
- 2481 Kathleen Place
- 2445 Kathleen Place
- 2493 Kathleen Place
- 2433 Kathleen Place
- 2484 Kathleen Place
- 2478 Kathleen Place
- 2498 Kathleen Place
- 2446 Kathleen Place
- 2423 Kathleen Place
- 2430 Kathleen Place
- 2415 Kathleen Place
- 2414 Kathleen Place
- 2467 56th St
- 2461 56th St
- 2473 56th St
- 2455 56th St
- 2409 56th St
- 2479 56th St
- 2407 Kathleen Place