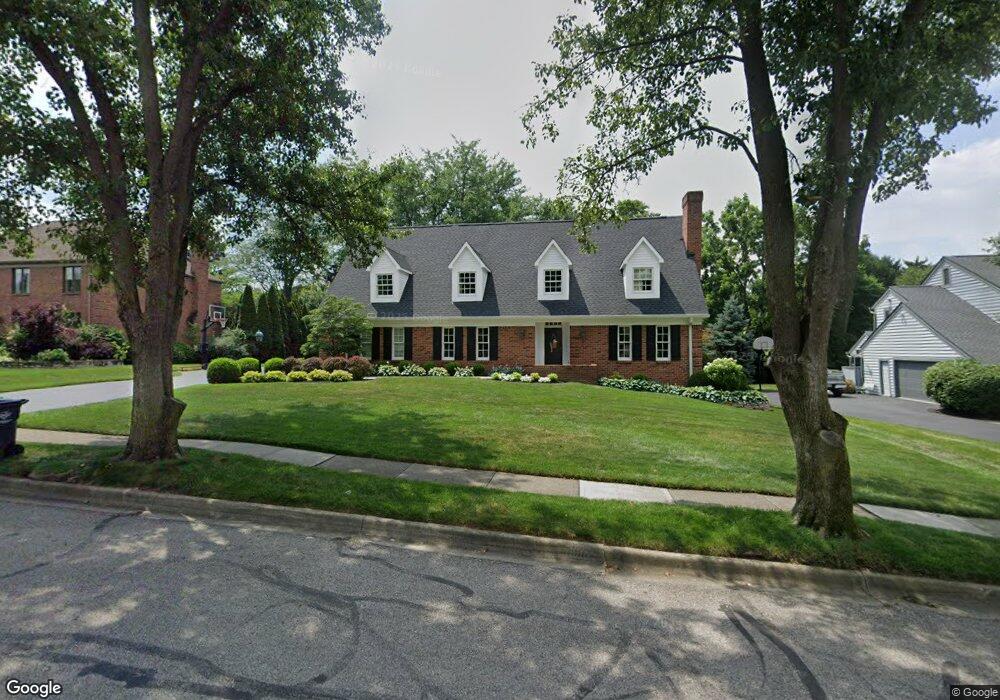
2469 Wenbury Rd Columbus, OH 43220
Estimated Value: $1,047,427 - $1,410,000
4
Beds
3
Baths
3,953
Sq Ft
$321/Sq Ft
Est. Value
About This Home
This home is located at 2469 Wenbury Rd, Columbus, OH 43220 and is currently estimated at $1,270,857, approximately $321 per square foot. 2469 Wenbury Rd is a home located in Franklin County with nearby schools including Greensview Elementary School, Hastings Middle School, and Upper Arlington High School.
Ownership History
Date
Name
Owned For
Owner Type
Purchase Details
Closed on
Mar 27, 2013
Sold by
Stamm Mandy L
Bought by
Stamm Mandy L and The Mandy L Stamm Family Trust
Current Estimated Value
Purchase Details
Closed on
Sep 12, 2007
Sold by
Menke Christine H and Menke Eric R
Bought by
Stamm Brent U and Stamm Mandy L
Home Financials for this Owner
Home Financials are based on the most recent Mortgage that was taken out on this home.
Original Mortgage
$417,000
Interest Rate
6.66%
Mortgage Type
Purchase Money Mortgage
Purchase Details
Closed on
Aug 23, 2002
Sold by
Favret William E and Favret Patricia L
Bought by
Menke Christine H
Home Financials for this Owner
Home Financials are based on the most recent Mortgage that was taken out on this home.
Original Mortgage
$495,000
Interest Rate
6.41%
Mortgage Type
Purchase Money Mortgage
Purchase Details
Closed on
Jul 16, 1987
Bought by
Favret William E
Create a Home Valuation Report for This Property
The Home Valuation Report is an in-depth analysis detailing your home's value as well as a comparison with similar homes in the area
Home Values in the Area
Average Home Value in this Area
Purchase History
| Date | Buyer | Sale Price | Title Company |
|---|---|---|---|
| Stamm Mandy L | -- | None Available | |
| Stamm Brent U | $609,000 | Chicago Tit | |
| Menke Christine H | $645,000 | Chicago Title | |
| Favret William E | $293,300 | -- |
Source: Public Records
Mortgage History
| Date | Status | Borrower | Loan Amount |
|---|---|---|---|
| Previous Owner | Stamm Brent U | $417,000 | |
| Previous Owner | Menke Christine H | $495,000 |
Source: Public Records
Tax History Compared to Growth
Tax History
| Year | Tax Paid | Tax Assessment Tax Assessment Total Assessment is a certain percentage of the fair market value that is determined by local assessors to be the total taxable value of land and additions on the property. | Land | Improvement |
|---|---|---|---|---|
| 2024 | $18,575 | $320,850 | $76,340 | $244,510 |
| 2023 | $18,345 | $320,845 | $76,335 | $244,510 |
| 2022 | $17,364 | $248,500 | $56,560 | $191,940 |
| 2021 | $15,371 | $248,500 | $56,560 | $191,940 |
| 2020 | $15,235 | $248,500 | $56,560 | $191,940 |
| 2019 | $13,677 | $197,230 | $56,560 | $140,670 |
| 2018 | $14,047 | $197,230 | $56,560 | $140,670 |
| 2017 | $13,572 | $197,230 | $56,560 | $140,670 |
| 2016 | $14,508 | $219,420 | $54,080 | $165,340 |
| 2015 | $14,495 | $219,420 | $54,080 | $165,340 |
| 2014 | $14,511 | $219,420 | $54,080 | $165,340 |
| 2013 | $7,259 | $208,950 | $51,485 | $157,465 |
Source: Public Records
Map
Nearby Homes
- 2560 Chartwell Rd
- 2681 Lane Rd
- 4861 Etrick Dr Unit 22
- 2231 Atlee Ct Unit 12
- 4441 Kipling Rd
- 4781 Coach Rd
- 2198 Sandston Rd
- 4450 Haverford Ct
- 2165 Partlow Dr
- 2060 Fontenay Place
- 5000 Slate Run Woods Ct
- 4499 Summit Ridge Rd
- 5055 Slate Run Woods Ct
- 4371 Latin Ln Unit 122
- 3715 Henderson Rd
- 4720 Merrifield Place Unit 67
- 4390 Dublin Rd
- 5227 Brynwood Dr
- 5277 Brandy Oaks Ln
- 5275 Brandy Oaks Ln
- 2479 Wenbury Rd
- 2459 Wenbury Rd
- 2486 Billiton Ct
- 2474 Billiton Ct
- 2448 Wenbury Rd
- 2441 Wenbury Rd
- 2436 Wenbury Rd
- 2462 Billiton Ct
- 4696 Stonehaven Dr
- 2464 Wenbury Rd
- 4684 Stonehaven Dr
- 2570 Billiton Ct
- 2494 Billiton Ct
- 2548 Billiton Ct
- 2424 Wenbury Rd
- 4672 Stonehaven Dr
- 2538 Billiton Ct
- 2480 Wenbury Rd
- 2450 Billiton Ct
- 2425 Wenbury Rd