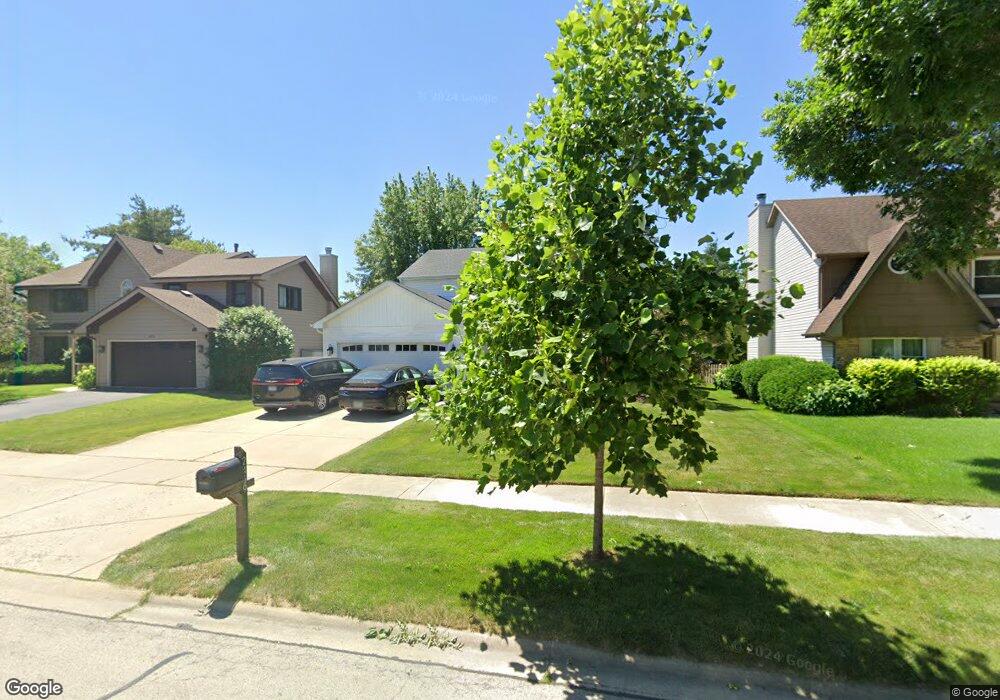
2469 Wendover Dr Unit 7 Naperville, IL 60565
Old Farm NeighborhoodEstimated Value: $575,000 - $639,000
4
Beds
3
Baths
2,444
Sq Ft
$245/Sq Ft
Est. Value
About This Home
This home is located at 2469 Wendover Dr Unit 7, Naperville, IL 60565 and is currently estimated at $598,113, approximately $244 per square foot. 2469 Wendover Dr Unit 7 is a home located in Will County with nearby schools including Kingsley Elementary School, Lincoln Jr. High School, and Naperville Central High School.
Ownership History
Date
Name
Owned For
Owner Type
Purchase Details
Closed on
Feb 27, 2021
Sold by
Poll Barry A and Poll Margaret M
Bought by
Poll Living Trust and Poll
Current Estimated Value
Purchase Details
Closed on
Sep 28, 1994
Sold by
Steffen James E and Steffen Adelia O
Bought by
Poll Barry A and Poll Margaret M
Home Financials for this Owner
Home Financials are based on the most recent Mortgage that was taken out on this home.
Original Mortgage
$174,400
Interest Rate
7.12%
Purchase Details
Closed on
Jun 17, 1987
Bought by
Poll Barry A Mar
Create a Home Valuation Report for This Property
The Home Valuation Report is an in-depth analysis detailing your home's value as well as a comparison with similar homes in the area
Home Values in the Area
Average Home Value in this Area
Purchase History
| Date | Buyer | Sale Price | Title Company |
|---|---|---|---|
| Poll Living Trust | -- | Burnet Title | |
| Poll Barry A | $218,000 | -- | |
| Poll Barry A Mar | $157,500 | -- |
Source: Public Records
Mortgage History
| Date | Status | Borrower | Loan Amount |
|---|---|---|---|
| Previous Owner | Poll Barry A | $174,400 |
Source: Public Records
Tax History Compared to Growth
Tax History
| Year | Tax Paid | Tax Assessment Tax Assessment Total Assessment is a certain percentage of the fair market value that is determined by local assessors to be the total taxable value of land and additions on the property. | Land | Improvement |
|---|---|---|---|---|
| 2024 | $10,356 | $168,511 | $43,531 | $124,980 |
| 2023 | $10,356 | $151,621 | $39,168 | $112,453 |
| 2022 | $8,990 | $136,694 | $35,312 | $101,382 |
| 2021 | $8,384 | $127,811 | $33,017 | $94,794 |
| 2020 | $8,511 | $130,114 | $33,612 | $96,502 |
| 2019 | $8,216 | $123,918 | $32,011 | $91,907 |
| 2018 | $7,837 | $118,604 | $30,638 | $87,966 |
| 2017 | $7,042 | $107,781 | $29,041 | $78,740 |
| 2016 | $6,498 | $98,600 | $29,100 | $69,500 |
| 2015 | $6,612 | $92,900 | $27,900 | $65,000 |
| 2014 | $6,612 | $92,900 | $27,900 | $65,000 |
| 2013 | $6,612 | $127,300 | $25,800 | $101,500 |
Source: Public Records
Map
Nearby Homes
- 2474 Wendover Dr
- 2471 Kingsley Dr
- 51 Ford Ln
- 36 Oak Bluff Ct
- 44 Oak Bluff Ct
- 203 Settlers Ct
- 20 Pinnacle Ct
- 15 Pinnacle Ct
- 284 Westbrook Cir
- 2421 River Woods Dr
- 2697 Fox River Ln
- 92 Salt River Ct
- 327 Danbury Dr
- 221 Hampshire Ct Unit 201D
- 2734 Alyssa Dr
- 2575 River Woods Dr
- 2279 Kaskaskia Ct
- 225 Hampshire Ct Unit 101A1
- 2633 Haddassah Dr
- 94 Cassin Rd
- 2473 Wendover Dr
- 2465 Wendover Dr Unit 7
- 2432 Kingsley Dr
- 105 Ardley Ct
- 2428 Kingsley Dr Unit 7
- 2461 Wendover Dr
- 101 Ardley Ct
- 2436 Kingsley Dr Unit 7
- 2424 Kingsley Dr
- 109 Ardley Ct
- 2466 Wendover Dr
- 2470 Wendover Dr Unit 7
- 2457 Wendover Dr
- 2462 Wendover Dr
- 2440 Kingsley Dr
- 2420 Kingsley Dr
- 2478 Wendover Dr
- 2458 Wendover Dr Unit 7
- 2453 Wendover Dr
- 113 Ardley Ct