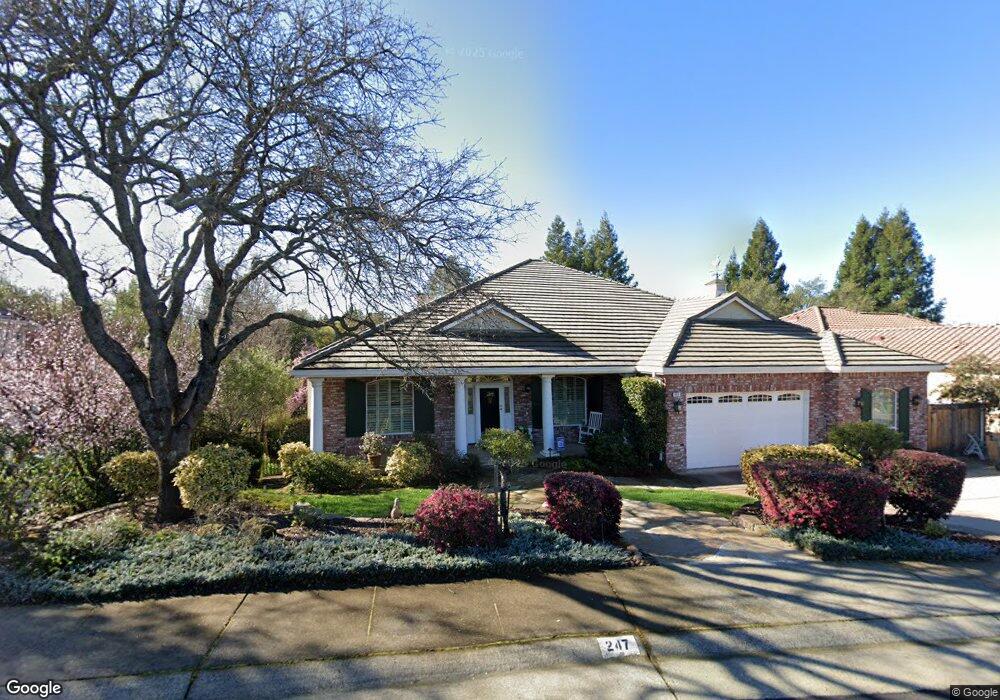
247 Alabaster Point Way Folsom, CA 95630
American River Canyon NeighborhoodEstimated Value: $831,000 - $1,563,000
2
Beds
3
Baths
4,018
Sq Ft
$310/Sq Ft
Est. Value
About This Home
This home is located at 247 Alabaster Point Way, Folsom, CA 95630 and is currently estimated at $1,243,774, approximately $309 per square foot. 247 Alabaster Point Way is a home located in Sacramento County with nearby schools including Carl H. Sundahl Elementary School, Sutter Middle School, and Folsom High School.
Ownership History
Date
Name
Owned For
Owner Type
Purchase Details
Closed on
Nov 16, 2021
Sold by
Weizer 1997 Revocable Trust
Bought by
Weizer 1997 Revocable Trust
Current Estimated Value
Home Financials for this Owner
Home Financials are based on the most recent Mortgage that was taken out on this home.
Original Mortgage
$1,233,562
Interest Rate
2.31%
Mortgage Type
Reverse Mortgage Home Equity Conversion Mortgage
Purchase Details
Closed on
Nov 8, 2006
Sold by
Weizer David E and Weizer Barbara J
Bought by
Weizer David E and Weizer Barbara J
Purchase Details
Closed on
Dec 3, 2001
Sold by
H C Elliott Inc
Bought by
Weizer David E and Weizer Barbara J
Home Financials for this Owner
Home Financials are based on the most recent Mortgage that was taken out on this home.
Original Mortgage
$109,600
Interest Rate
6.67%
Mortgage Type
Seller Take Back
Create a Home Valuation Report for This Property
The Home Valuation Report is an in-depth analysis detailing your home's value as well as a comparison with similar homes in the area
Home Values in the Area
Average Home Value in this Area
Purchase History
| Date | Buyer | Sale Price | Title Company |
|---|---|---|---|
| Weizer 1997 Revocable Trust | -- | Timios | |
| Weizer David E | -- | None Available | |
| Weizer David E | $137,000 | Stewart Title |
Source: Public Records
Mortgage History
| Date | Status | Borrower | Loan Amount |
|---|---|---|---|
| Previous Owner | Weizer 1997 Revocable Trust | $1,233,562 | |
| Previous Owner | Weizer 1997 Revocable Trust | $0 | |
| Previous Owner | Weizer David E | $109,600 |
Source: Public Records
Tax History Compared to Growth
Tax History
| Year | Tax Paid | Tax Assessment Tax Assessment Total Assessment is a certain percentage of the fair market value that is determined by local assessors to be the total taxable value of land and additions on the property. | Land | Improvement |
|---|---|---|---|---|
| 2025 | $11,073 | $962,746 | $202,378 | $760,368 |
| 2024 | $11,073 | $943,869 | $198,410 | $745,459 |
| 2023 | $10,831 | $925,363 | $194,520 | $730,843 |
| 2022 | $10,690 | $907,219 | $190,706 | $716,513 |
| 2021 | $10,539 | $889,431 | $186,967 | $702,464 |
| 2020 | $10,402 | $880,312 | $185,050 | $695,262 |
| 2019 | $10,234 | $863,052 | $181,422 | $681,630 |
| 2018 | $9,956 | $846,130 | $177,865 | $668,265 |
| 2017 | $9,316 | $829,540 | $174,378 | $655,162 |
| 2016 | $9,687 | $813,275 | $170,959 | $642,316 |
| 2015 | $9,373 | $801,060 | $168,392 | $632,668 |
| 2014 | $8,922 | $785,369 | $165,094 | $620,275 |
Source: Public Records
Map
Nearby Homes
- 119 Flat Rock Dr
- 140 Pinnacle Butte Ct
- 108 Feather Falls Cir
- 102 Painted Rock Place
- 137 Tomlinson Dr
- 6025 Oak Hill Dr
- 9909 Granite Springs Ct
- 206 American River Canyon Dr
- 100 Englehart Dr
- 318 Canyon Falls Dr
- 100 Hinkle Ct
- 9875 Granite View Ln
- 340 Stonebrook Dr
- 147 American River Canyon Dr
- 320 Stonebrook Dr
- 291 Meadowrock Way
- 375 Willowood Way
- 240 Stonebrook Dr
- 276 Meadowrock Way
- 5928 Wedgewood Dr
- 251 Alabaster Point Way
- 243 Alabaster Point Way
- 120 Knob Fork Ct
- 250 American River Canyon Dr
- 248 American River Canyon Dr
- 124 Knob Fork Ct
- 252 American River Canyon Dr
- 239 Alabaster Point Way
- 246 American River Canyon Dr
- 254 American River Canyon Dr
- 244 American River Canyon Dr
- 121 Knob Fork Ct
- 125 Knob Fork Ct
- 117 Knob Fork Ct
- 242 American River Canyon Dr
- 249 American River Canyon Dr
- 251 American River Canyon Dr
- 100 Ash Creek Ct
- 256 American River Canyon Dr
- 102 Feather Falls Cir