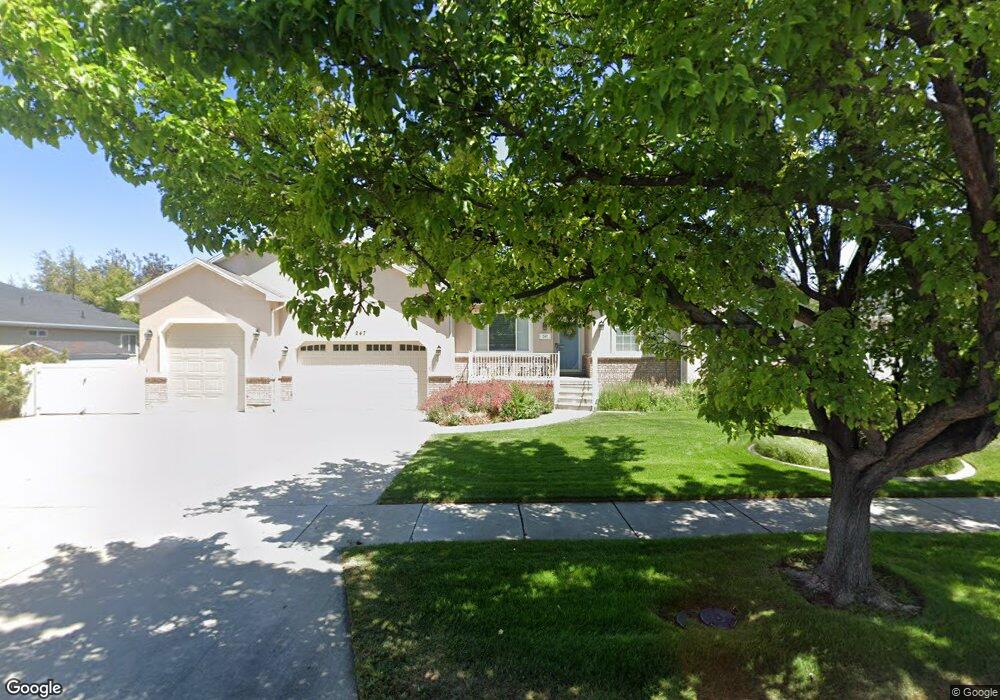
247 Pebblebrook Way Draper, UT 84020
Estimated Value: $689,000 - $878,000
3
Beds
3
Baths
1,979
Sq Ft
$404/Sq Ft
Est. Value
About This Home
This home is located at 247 Pebblebrook Way, Draper, UT 84020 and is currently estimated at $798,840, approximately $403 per square foot. 247 Pebblebrook Way is a home located in Salt Lake County with nearby schools including Corner Canyon High School, Draper Park Middle School, and Channing Hall.
Ownership History
Date
Name
Owned For
Owner Type
Purchase Details
Closed on
Nov 5, 2012
Sold by
Corcheron Vickie L
Bought by
Crocheron Kenneth and Crocheron Vickie L
Current Estimated Value
Home Financials for this Owner
Home Financials are based on the most recent Mortgage that was taken out on this home.
Original Mortgage
$453,000
Outstanding Balance
$312,438
Interest Rate
3.35%
Mortgage Type
Reverse Mortgage Home Equity Conversion Mortgage
Estimated Equity
$486,402
Purchase Details
Closed on
Jan 8, 1996
Sold by
Crocheron Vickie
Bought by
Crocheron Vickie L
Home Financials for this Owner
Home Financials are based on the most recent Mortgage that was taken out on this home.
Original Mortgage
$120,000
Interest Rate
7.38%
Purchase Details
Closed on
Aug 30, 1995
Sold by
Reynolds Howard
Bought by
Crocheron Vickie
Purchase Details
Closed on
Aug 24, 1994
Sold by
Advantage Communities Inc
Bought by
Reynolds Howard
Create a Home Valuation Report for This Property
The Home Valuation Report is an in-depth analysis detailing your home's value as well as a comparison with similar homes in the area
Home Values in the Area
Average Home Value in this Area
Purchase History
| Date | Buyer | Sale Price | Title Company |
|---|---|---|---|
| Crocheron Kenneth | -- | Security Title Ins Agency | |
| Crocheron Vickie L | -- | -- | |
| Crocheron Vickie | -- | -- | |
| Reynolds Howard | -- | -- |
Source: Public Records
Mortgage History
| Date | Status | Borrower | Loan Amount |
|---|---|---|---|
| Open | Crocheron Kenneth | $453,000 | |
| Previous Owner | Crocheron Vickie L | $120,000 |
Source: Public Records
Tax History
| Year | Tax Paid | Tax Assessment Tax Assessment Total Assessment is a certain percentage of the fair market value that is determined by local assessors to be the total taxable value of land and additions on the property. | Land | Improvement |
|---|---|---|---|---|
| 2025 | $41 | $690,800 | $255,200 | $435,600 |
| 2024 | $41 | $663,600 | $245,800 | $417,800 |
| 2023 | $532 | $651,300 | $236,600 | $414,700 |
| 2022 | $532 | $664,400 | $232,000 | $432,400 |
| 2021 | $146 | $485,600 | $218,600 | $267,000 |
| 2020 | $2,964 | $439,600 | $191,800 | $247,800 |
| 2019 | $149 | $431,100 | $191,800 | $239,300 |
| 2018 | $76 | $419,200 | $187,900 | $231,300 |
| 2017 | $85 | $391,300 | $178,800 | $212,500 |
| 2016 | $2,679 | $369,400 | $171,700 | $197,700 |
| 2015 | $176 | $348,300 | $175,100 | $173,200 |
| 2014 | $2,554 | $318,600 | $161,400 | $157,200 |
Source: Public Records
Map
Nearby Homes
- 480 E Foxstone Cove
- 352 E Mistilake Ln Unit 20
- 224 Spencer Peak Way Unit F6
- 196 E Spencer Peak Way Unit D6
- 633 E Vandalay Ln
- 181 Mountain Peak Dr
- 657 E Vandalay Ln
- 205 Rockey Park Ln
- 186 E Kimballfield Ln
- 13160 S 300 E
- 439 Midlake Dr
- 11856 Cottage Side Way
- 246 W Golden Harvest Rd
- 265 E 13275 S
- 847 E Willow Springs Ln
- 902 E 12650 S
- 834 E 12085 S
- 622 E Sawback Ln
- 264 W 13165 S
- 11737 S Nigel Peak Ln
- 237 Pebblebrook Way
- 237 E Pebblebrook Way
- 257 Pebblebrook Way
- 262 Rawlins Ln
- 12503 Rawlins Ln
- 12503 S Rawlins Ln
- 246 E Pebblebrook Way
- 246 Pebblebrook Way
- 258 Rawlins Ln
- 258 E Rawlins Ln
- 263 E Pebblebrook Way
- 234 Pebblebrook Way
- 234 E Pebblebrook Way
- 223 Pebblebrook Way
- 263 Pebblebrook Way
- 12538 S Pebblebrook Way
- 12538 Pebblebrook Way
- 12491 S Rawlins Ln
- 12491 Rawlins Ln
- 248 Rawlins Ln
Your Personal Tour Guide
Ask me questions while you tour the home.