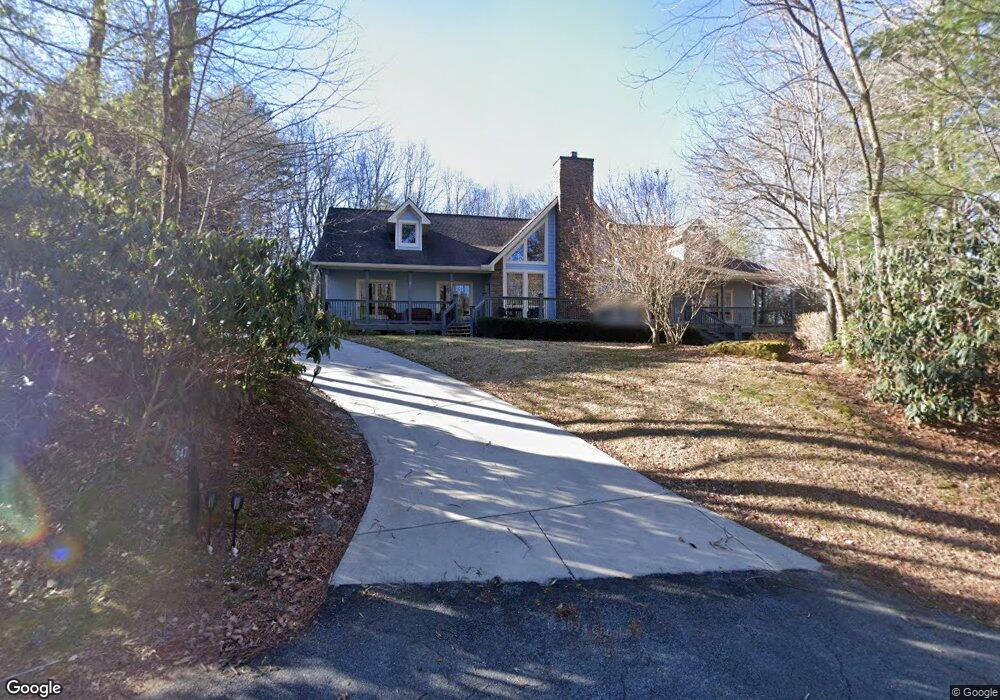
247 Rebel Cir Dillard, GA 30537
Estimated Value: $697,111 - $1,000,000
4
Beds
4
Baths
4,848
Sq Ft
$183/Sq Ft
Est. Value
About This Home
This home is located at 247 Rebel Cir, Dillard, GA 30537 and is currently estimated at $889,528, approximately $183 per square foot. 247 Rebel Cir is a home located in Rabun County with nearby schools including Rabun County Primary School and Rabun County High School.
Ownership History
Date
Name
Owned For
Owner Type
Purchase Details
Closed on
Aug 28, 2019
Sold by
Nichols J Howard
Bought by
Resh Sanford E and Resh Sherry K
Current Estimated Value
Purchase Details
Closed on
Mar 22, 2016
Sold by
Nichols James Howard
Bought by
Nichols J Howard
Purchase Details
Closed on
Jul 8, 2011
Sold by
Emerson Jerry W
Bought by
Nichols J Howard
Purchase Details
Closed on
Mar 1, 2001
Bought by
Emerson Jerry W
Purchase Details
Closed on
Nov 1, 1998
Purchase Details
Closed on
Aug 1, 1987
Purchase Details
Closed on
Aug 1, 1980
Purchase Details
Closed on
Mar 1, 1978
Create a Home Valuation Report for This Property
The Home Valuation Report is an in-depth analysis detailing your home's value as well as a comparison with similar homes in the area
Home Values in the Area
Average Home Value in this Area
Purchase History
| Date | Buyer | Sale Price | Title Company |
|---|---|---|---|
| Resh Sanford E | $472,000 | -- | |
| Resh Sanford E | $472,000 | -- | |
| Nichols J Howard | -- | -- | |
| Nichols J Howard | -- | -- | |
| Nichols J Howard | $462,500 | -- | |
| Nichols J Howard | $462,500 | -- | |
| Nichols J Howard | $462,500 | -- | |
| Emerson Jerry W | $18,500 | -- | |
| Emerson Jerry W | $18,500 | -- | |
| -- | $9,500 | -- | |
| -- | $9,500 | -- | |
| -- | $13,000 | -- | |
| -- | $13,000 | -- | |
| -- | $10,700 | -- | |
| -- | $10,700 | -- | |
| -- | $7,000 | -- | |
| -- | $7,000 | -- |
Source: Public Records
Tax History Compared to Growth
Tax History
| Year | Tax Paid | Tax Assessment Tax Assessment Total Assessment is a certain percentage of the fair market value that is determined by local assessors to be the total taxable value of land and additions on the property. | Land | Improvement |
|---|---|---|---|---|
| 2025 | $7,382 | $267,226 | $25,000 | $242,226 |
| 2024 | $7,030 | $254,490 | $25,000 | $229,490 |
| 2023 | $6,667 | $213,041 | $20,000 | $193,041 |
| 2022 | $3,583 | $195,754 | $17,500 | $178,254 |
| 2021 | $3,222 | $171,831 | $10,000 | $161,831 |
| 2020 | $3,152 | $162,482 | $10,000 | $152,482 |
| 2019 | $3,524 | $180,397 | $8,000 | $172,397 |
| 2018 | $3,537 | $180,397 | $8,000 | $172,397 |
| 2017 | $3,379 | $179,727 | $8,000 | $171,727 |
| 2016 | $3,179 | $168,634 | $8,000 | $160,634 |
| 2015 | $3,233 | $167,879 | $8,000 | $159,879 |
| 2014 | $3,250 | $167,879 | $8,000 | $159,879 |
Source: Public Records
Map
Nearby Homes
- 137 Pleasant Mountain Dr
- 81 Lost Valley Dr
- LOT 1 Pleasant Mountain Dr
- 119 Buttermilk Cir
- 0 Saddleback Cir Unit 10538862
- Lot 35 Thomas Knob
- 1007 Sky High Dr
- 480 Sky High Dr
- 291 Saddleback Cir
- 48 Little Bear Trail
- 156 Tahoe Ln
- 1154 Saddleback Cir
- 47 Brasstown Ln
- 0 Happy Hill Rd Unit 26041800
- 0 Labelle Cir Unit LOT 92 10528719
- 767 Driver Ln
- 70 Fairway Ln
- Lot 1 Ridgepole Dr
- LOT 17 Ridgepole Dr
- 334 Eagle Cir
- 247 Rebel Cir Unit 43
- 229 Rebel Cir
- 279 Rebel Cir
- 279 279 Rebel Cir
- 517 Rebel Cir
- 327 Rebel Cir
- 458 Rebel Cir
- 439 Rebel Cir
- 439 Rebel Cir Unit 47
- 333 Rebel Cir
- 333 Rebel Cir Unit 323
- 183 Rebel Cir
- 183 Rebel Cir Unit 38
- 333 Rebel Circle #323 Unit 46
- Lot 39 Rebel Cir
- 522 Rebel Cir
- 601 Rebel Cir
- 85 Bald Mountain Rd Unit 1 & 2
- 85 Bald Mountain Rd
- 85 Bald Mountain Rd Unit 1, 2 & 3