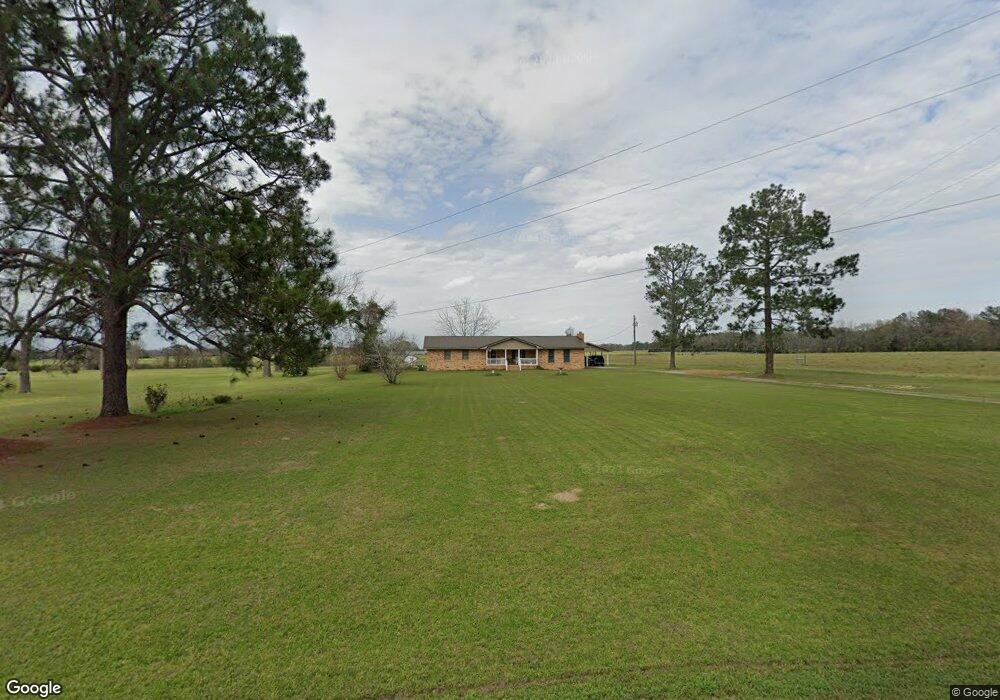
247 Rockhouse Rd E Cordele, GA 31015
Estimated Value: $200,819 - $253,000
3
Beds
2
Baths
1,916
Sq Ft
$118/Sq Ft
Est. Value
About This Home
This home is located at 247 Rockhouse Rd E, Cordele, GA 31015 and is currently estimated at $225,705, approximately $117 per square foot. 247 Rockhouse Rd E is a home located in Crisp County with nearby schools including Crisp County Primary School, Crisp County Elementary School, and Crisp County Middle School.
Ownership History
Date
Name
Owned For
Owner Type
Purchase Details
Closed on
Nov 30, 2023
Sold by
Stephens Mary Nell
Bought by
Stephens David Keith and Stephens Kevin Wayne
Current Estimated Value
Purchase Details
Closed on
Oct 12, 2018
Sold by
Stephens Mary Nell
Bought by
Stephens Mary Nell and Stephens Enoch Wayne
Home Financials for this Owner
Home Financials are based on the most recent Mortgage that was taken out on this home.
Original Mortgage
$50,573
Interest Rate
4.6%
Mortgage Type
New Conventional
Purchase Details
Closed on
Oct 31, 1994
Sold by
Collins Lewis and Collins Mary
Bought by
Collins Mary Nell
Purchase Details
Closed on
Dec 18, 1985
Sold by
Butler Jewel J
Bought by
Collins Lewis and Collins Mary
Purchase Details
Closed on
Sep 26, 1984
Bought by
Butler Jewel J
Create a Home Valuation Report for This Property
The Home Valuation Report is an in-depth analysis detailing your home's value as well as a comparison with similar homes in the area
Purchase History
| Date | Buyer | Sale Price | Title Company |
|---|---|---|---|
| Stephens David Keith | -- | -- | |
| Stephens Mary Nell | -- | -- | |
| Collins Mary Nell | -- | -- | |
| Collins Lewis | $62,500 | -- | |
| Butler Jewel J | -- | -- |
Source: Public Records
Mortgage History
| Date | Status | Borrower | Loan Amount |
|---|---|---|---|
| Previous Owner | Stephens Mary Nell | $50,573 |
Source: Public Records
Tax History
| Year | Tax Paid | Tax Assessment Tax Assessment Total Assessment is a certain percentage of the fair market value that is determined by local assessors to be the total taxable value of land and additions on the property. | Land | Improvement |
|---|---|---|---|---|
| 2025 | $1,214 | $63,923 | $4,703 | $59,220 |
| 2024 | $1,150 | $57,780 | $4,354 | $53,426 |
| 2023 | $1,111 | $55,022 | $4,354 | $50,668 |
| 2022 | $1,005 | $51,255 | $3,484 | $47,771 |
| 2021 | $985 | $48,358 | $3,484 | $44,874 |
| 2020 | $973 | $48,358 | $3,484 | $44,874 |
| 2019 | $965 | $48,358 | $3,484 | $44,874 |
| 2018 | $1,449 | $47,309 | $2,063 | $45,246 |
| 2017 | $1,455 | $47,309 | $2,063 | $45,246 |
| 2016 | $1,453 | $47,309 | $2,063 | $45,246 |
| 2015 | -- | $47,309 | $2,063 | $45,246 |
| 2014 | -- | $47,309 | $2,063 | $45,246 |
| 2013 | -- | $47,308 | $2,063 | $45,245 |
Source: Public Records
Map
Nearby Homes
- 2608 U S 41
- 11 Lochridge Way
- 68 Aberdeen Cir
- 2909 Old Hatley Rd
- 0 Aberdeen Circle Lt# 28
- 114 Brier Patch Rd
- 49 Aberdeen Cir
- 56 Aberdeen Cir
- TBD Aberdeen Circle Lot#28
- 157 Bobwhite Dr
- 2115 Royal Rd
- 854 Rockhouse Rd E
- 304 Timberland Dr
- Lot #13 Lakeview Dr
- 1806 Georgia 90
- 120 Patriot Dr
- 2298 U S 41
- 141 Ruby St
- 2326 Joe Wright Dr
- 112 Judy Ave
- 283 Rockhouse Rd E
- 244 Rockhouse Rd E
- 231 Rockhouse Rd E
- 250 Rockhouse Rd E
- 232 Rockhouse Rd E
- 271 Rockhouse Rd E
- 266 Rockhouse Rd E
- 238 Rockhouse Rd E
- 277 Rockhouse Rd E
- 281 Rockhouse Rd E
- 213 Rockhouse Rd E
- 212 Rockhouse Rd E
- 295 Rockhouse Rd E
- 301 Rockhouse Rd E
- 197 Bullington Rd
- 197 Bullington Rd
- 282 Rockhouse Rd E
- 145 Tyson Rd
- 333 Rockhouse Rd E
- 326 Rockhouse Rd E
Your Personal Tour Guide
Ask me questions while you tour the home.