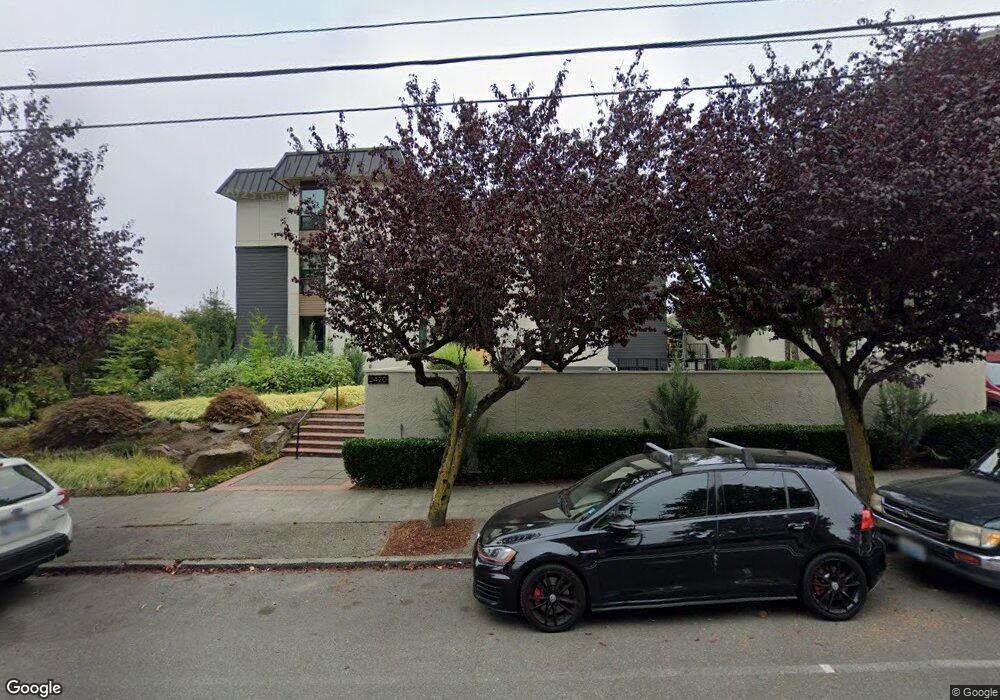
2470 Dexter Ave N Unit 1C Seattle, WA 98109
East Queen Anne NeighborhoodEstimated Value: $553,421 - $880,000
2
Beds
2
Baths
1,344
Sq Ft
$498/Sq Ft
Est. Value
About This Home
This home is located at 2470 Dexter Ave N Unit 1C, Seattle, WA 98109 and is currently estimated at $668,855, approximately $497 per square foot. 2470 Dexter Ave N Unit 1C is a home located in King County with nearby schools including John Hay Elementary School, Mcclure Middle School, and Lincoln High School.
Ownership History
Date
Name
Owned For
Owner Type
Purchase Details
Closed on
Dec 21, 2017
Sold by
Neill Nancy A O
Bought by
Neill Kerry J O and Nancy A Oneill Irrevocable Living Trust
Current Estimated Value
Purchase Details
Closed on
Sep 22, 2016
Sold by
Neill Nancy A O
Bought by
Neill Nancy A O
Purchase Details
Closed on
Aug 3, 2010
Sold by
Fisser Jennifer
Bought by
Ryder Steve and Ryder Nancy
Purchase Details
Closed on
Dec 1, 2003
Sold by
Vankeirsbilck Warren J
Bought by
Fisser Jennifer
Home Financials for this Owner
Home Financials are based on the most recent Mortgage that was taken out on this home.
Original Mortgage
$263,400
Interest Rate
7.75%
Create a Home Valuation Report for This Property
The Home Valuation Report is an in-depth analysis detailing your home's value as well as a comparison with similar homes in the area
Home Values in the Area
Average Home Value in this Area
Purchase History
| Date | Buyer | Sale Price | Title Company |
|---|---|---|---|
| Neill Kerry J O | -- | None Available | |
| Neill Nancy A O | -- | None Available | |
| Ryder Steve | $343,000 | The Talon Grou | |
| Fisser Jennifer | $309,950 | Chicago Title |
Source: Public Records
Mortgage History
| Date | Status | Borrower | Loan Amount |
|---|---|---|---|
| Previous Owner | Fisser Jennifer | $263,400 |
Source: Public Records
Tax History Compared to Growth
Tax History
| Year | Tax Paid | Tax Assessment Tax Assessment Total Assessment is a certain percentage of the fair market value that is determined by local assessors to be the total taxable value of land and additions on the property. | Land | Improvement |
|---|---|---|---|---|
| 2024 | $724 | $622,000 | $240,400 | $381,600 |
| 2023 | $734 | $697,000 | $240,400 | $456,600 |
| 2022 | $803 | $639,000 | $225,100 | $413,900 |
| 2021 | $822 | $602,000 | $225,100 | $376,900 |
| 2020 | $801 | $288,000 | $112,500 | $175,500 |
| 2018 | $3,145 | $288,000 | $112,500 | $175,500 |
| 2017 | $4,472 | $541,000 | $158,500 | $382,500 |
| 2016 | $4,355 | $469,000 | $117,600 | $351,400 |
| 2015 | $3,879 | $446,000 | $117,600 | $328,400 |
| 2014 | -- | $406,000 | $107,400 | $298,600 |
| 2013 | -- | $342,000 | $97,200 | $244,800 |
Source: Public Records
Map
Nearby Homes
- 2524 Westlake Ave N Unit E
- 2542 Westlake Ave N Unit 5
- 2550 Westlake Ave N Unit 1-117
- 2423 8th Ave N Unit 101
- 2565 Dexter Ave N Unit 103
- 2419 8th Ave N Unit 202
- 2466 Westlake Ave N Unit 5
- 566 Mcgraw St
- 2420 8th Ave N Unit N102
- 2400 8th Ave N Unit 2
- 2553 5th Ave N
- 2450 Westlake Ave N Unit 6
- 2167 Dexter Ave N Unit 401
- 559 Mcgraw St Unit 402
- 559 Mcgraw St Unit 204
- 2420 Westlake Ave N Unit 11
- 2134 Waverly Place N Unit 303
- 2766 Westlake Ave N Unit A
- 2620 4th Ave N Unit 603
- 2144 Westlake Ave N Unit 1DO7
- 2470 Dexter Ave N Unit 101
- 2470 Dexter Ave N Unit 202
- 2470 Dexter Ave N Unit 103
- 2470 Dexter Ave N Unit 401
- 2470 Dexter Ave N Unit 403
- 2470 Dexter Ave N Unit 3A
- 2470 Dexter Ave N Unit 4C
- 2470 Dexter Ave N Unit 3B
- 2470 Dexter Ave N Unit 4A
- 2470 Dexter Ave N Unit 4B
- 2470 Dexter Ave N Unit 3C
- 2470 Dexter Ave N Unit 2C
- 2470 Dexter Ave N Unit 2B
- 2470 Dexter Ave N Unit 2A
- 2470 Dexter Ave N Unit 1B
- 2470 Dexter Ave N Unit 1A
- 2470 Dexter Ave N Unit 301
- 2470 Dexter Ave N Unit 302
- 2464 Dexter Ave N
- 2464 Dexter Ave N Unit 2N