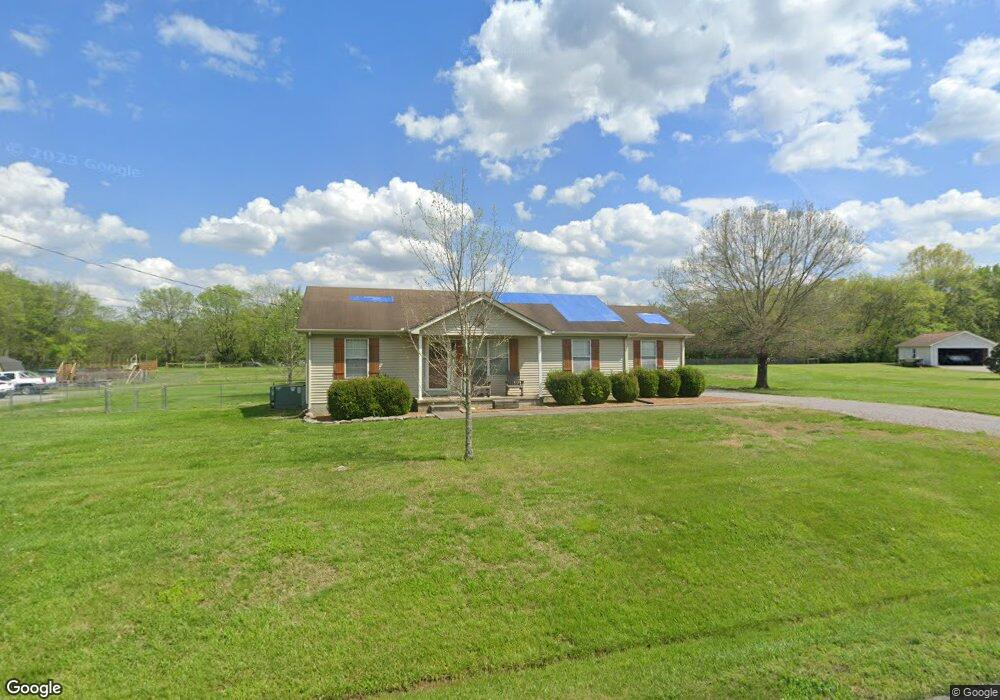
2471 Canterbury Chase Murfreesboro, TN 37128
Estimated Value: $331,873 - $366,000
--
Bed
2
Baths
1,380
Sq Ft
$258/Sq Ft
Est. Value
About This Home
This home is located at 2471 Canterbury Chase, Murfreesboro, TN 37128 and is currently estimated at $356,218, approximately $258 per square foot. 2471 Canterbury Chase is a home located in Rutherford County with nearby schools including Rockvale Elementary School, Rockvale Middle School, and Rockvale High School.
Ownership History
Date
Name
Owned For
Owner Type
Purchase Details
Closed on
May 8, 2013
Sold by
Mcelhiney Michael S
Bought by
Mcelhiney Michael S Linds
Current Estimated Value
Home Financials for this Owner
Home Financials are based on the most recent Mortgage that was taken out on this home.
Original Mortgage
$99,838
Outstanding Balance
$70,376
Interest Rate
3.44%
Mortgage Type
FHA
Estimated Equity
$285,842
Purchase Details
Closed on
Mar 24, 2006
Sold by
Owens Kevin W and Owens Vicki L
Bought by
Mcelhiney Michael S
Home Financials for this Owner
Home Financials are based on the most recent Mortgage that was taken out on this home.
Original Mortgage
$110,269
Interest Rate
6.23%
Mortgage Type
Purchase Money Mortgage
Purchase Details
Closed on
Jul 9, 1997
Sold by
Owens Kevin W
Bought by
Owens Kevin W
Purchase Details
Closed on
Jul 1, 1994
Sold by
Rowland James O
Bought by
Rowland & Wilson Realty Co
Create a Home Valuation Report for This Property
The Home Valuation Report is an in-depth analysis detailing your home's value as well as a comparison with similar homes in the area
Home Values in the Area
Average Home Value in this Area
Purchase History
| Date | Buyer | Sale Price | Title Company |
|---|---|---|---|
| Mcelhiney Michael S Linds | -- | -- | |
| Mcelhiney Michael S | $112,000 | -- | |
| Mcelhiney Michael S | $112,000 | -- | |
| Owens Kevin W | -- | -- | |
| Rowland & Wilson Realty Co | -- | -- |
Source: Public Records
Mortgage History
| Date | Status | Borrower | Loan Amount |
|---|---|---|---|
| Open | Mcelhiney Michael S Linds | $99,838 | |
| Previous Owner | Mcelhiney Michael S | $110,269 |
Source: Public Records
Tax History Compared to Growth
Tax History
| Year | Tax Paid | Tax Assessment Tax Assessment Total Assessment is a certain percentage of the fair market value that is determined by local assessors to be the total taxable value of land and additions on the property. | Land | Improvement |
|---|---|---|---|---|
| 2025 | $1,349 | $71,875 | $13,750 | $58,125 |
| 2024 | $1,349 | $71,875 | $13,750 | $58,125 |
| 2023 | $1,356 | $72,300 | $13,750 | $58,550 |
| 2022 | $1,169 | $72,300 | $13,750 | $58,550 |
| 2021 | $1,146 | $51,625 | $9,375 | $42,250 |
| 2020 | $1,146 | $51,625 | $9,375 | $42,250 |
| 2019 | $1,146 | $51,625 | $9,375 | $42,250 |
| 2018 | $886 | $42,225 | $0 | $0 |
| 2017 | $740 | $27,600 | $0 | $0 |
| 2016 | $740 | $27,600 | $0 | $0 |
| 2015 | $740 | $27,600 | $0 | $0 |
| 2014 | $686 | $27,600 | $0 | $0 |
| 2013 | -- | $26,650 | $0 | $0 |
Source: Public Records
Map
Nearby Homes
- 2437 Canterbury Chase
- 1845 Cromwell Dr
- 4008 Michelle St
- 4019 Clara Woods Way
- 5807 Shoreline Dr
- 3525 Darrell Dr
- 4014 Clara Woods Way
- 5730 Craven Ln
- 4024 Tawnya Charles Ln
- 4007 Clara Woods Way
- 3609 Bumming Ct
- 4018 Colleton Ln
- 5803 Craven Ln
- 2550 Thompson Rd
- 4016 Tawnya Charles Ln
- 4007 Colleton Ln
- 0 Darrell Dr
- 3839 Hallanday Dr
- 4013 Tawnya Charles Ln
- 4009 Tawnya Charles Ln
- 2467 Canterbury Chase
- 2468 Canterbury Chase
- 2476 Canterbury Chase
- 2475 Canterbury Chase
- 2479 Canterbury Chase
- 2480 Canterbury Chase
- 2456 Canterbury Chase
- 2483 Canterbury Chase
- 2445 Canterbury Chase
- 2446 Canterbury Chase
- 111 Sirtim Ct
- 115 Sirtim Ct
- 167 Armor Place
- 203 Armor Place
- 107 Sirtim Ct
- 2455 Canterbury Chase
- 2441 Canterbury Chase
- 2438 Canterbury Chase
- 118 Sirtim Ct
- 161 Armor Place