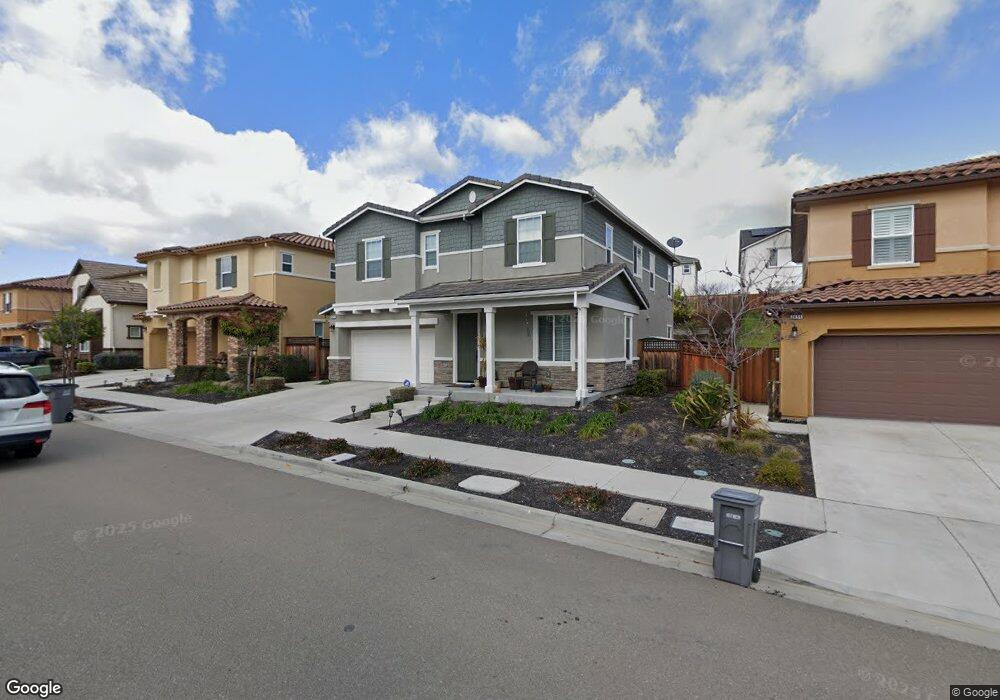
2471 Vinton Ave Dublin, CA 94568
Estimated Value: $1,928,000 - $2,020,000
5
Beds
4
Baths
2,668
Sq Ft
$736/Sq Ft
Est. Value
About This Home
This home is located at 2471 Vinton Ave, Dublin, CA 94568 and is currently estimated at $1,963,685, approximately $736 per square foot. 2471 Vinton Ave is a home with nearby schools including J.M. Amador Elementary School, Dublin High School, and SPRINGFIELD MONTESSORI SCHOOL.
Ownership History
Date
Name
Owned For
Owner Type
Purchase Details
Closed on
Nov 16, 2017
Sold by
Panneerselvam Sivasubramanian and Radhakrishnan Archana
Bought by
Panneerselvan Sivasubramanian and Radhakrishnan Archanan
Current Estimated Value
Home Financials for this Owner
Home Financials are based on the most recent Mortgage that was taken out on this home.
Original Mortgage
$71,400
Outstanding Balance
$60,374
Interest Rate
4.2%
Mortgage Type
Credit Line Revolving
Estimated Equity
$1,903,311
Purchase Details
Closed on
Dec 22, 2014
Sold by
Brookfield Windwood Llc
Bought by
Panneerselvam Sivasubramanian and Radhakrishnan Archana
Home Financials for this Owner
Home Financials are based on the most recent Mortgage that was taken out on this home.
Original Mortgage
$778,304
Outstanding Balance
$597,930
Interest Rate
4%
Mortgage Type
New Conventional
Estimated Equity
$1,365,755
Create a Home Valuation Report for This Property
The Home Valuation Report is an in-depth analysis detailing your home's value as well as a comparison with similar homes in the area
Purchase History
| Date | Buyer | Sale Price | Title Company |
|---|---|---|---|
| Panneerselvan Sivasubramanian | -- | None Available | |
| Panneerselvam Sivasubramanian | $973,000 | First American Title |
Source: Public Records
Mortgage History
| Date | Status | Borrower | Loan Amount |
|---|---|---|---|
| Open | Panneerselvan Sivasubramanian | $71,400 | |
| Open | Panneerselvam Sivasubramanian | $778,304 |
Source: Public Records
Tax History
| Year | Tax Paid | Tax Assessment Tax Assessment Total Assessment is a certain percentage of the fair market value that is determined by local assessors to be the total taxable value of land and additions on the property. | Land | Improvement |
|---|---|---|---|---|
| 2025 | $15,699 | $1,162,119 | $350,567 | $818,552 |
| 2024 | $15,699 | $1,139,201 | $343,695 | $802,506 |
| 2023 | $15,877 | $1,123,729 | $336,957 | $786,772 |
| 2022 | $15,664 | $1,094,695 | $330,350 | $771,345 |
| 2021 | $15,509 | $1,073,099 | $323,874 | $756,225 |
| 2020 | $14,540 | $1,069,028 | $320,554 | $748,474 |
| 2019 | $14,532 | $1,048,074 | $314,271 | $733,803 |
| 2018 | $14,182 | $1,027,529 | $308,111 | $719,418 |
| 2017 | $13,988 | $1,007,382 | $302,069 | $705,313 |
| 2016 | $12,773 | $987,634 | $296,148 | $691,486 |
| 2015 | $12,319 | $972,800 | $291,700 | $681,100 |
| 2014 | $4,848 | $363,442 | $363,442 | $0 |
Source: Public Records
Map
Nearby Homes
- 3956 Jordan Ranch Dr
- 2336 Carbondale Way
- 4371 Panorama Dr
- 2239 Central Pkwy
- 2008 Confidence Way
- 1937 Whitney Ave
- 1935 Ingalls Way
- 2100 Carbondale Cir
- 1949 Michael Ave
- 5271 Salerno Dr
- 1913 Michael Ave
- 1705 Central Pkwy
- 1901 Michael Ave
- 1691 S Wren St
- 1683 S Wren St
- 4433 Cherico Ln
- 4152 Kevin St
- 4156 Kevin St
- 3198 Vittoria Loop
- 4052 Knightstown St
- 2485 Vinton Ave
- 2455 Vinton Ave
- 2501 Vinton Ave
- 4671 Valley Vista Dr
- 2437 Vinton Ave
- 4675 Valley Vista Dr
- 4657 Valley Vista Dr
- 2472 Vinton Ave
- 2456 Vinton Ave
- 2513 Vinton Ave
- 2438 Vinton Ave
- 4653 Valley Vista Dr
- 2433 Vinton Ave
- 2486 Vinton Ave
- 4679 Valley Vista Dr
- 2500 Vinton Ave
- 2527 Vinton Ave
- 2426 Vinton Ave
- 4651 Valley Vista Dr
- 4683 Valley Vista Dr
Your Personal Tour Guide
Ask me questions while you tour the home.