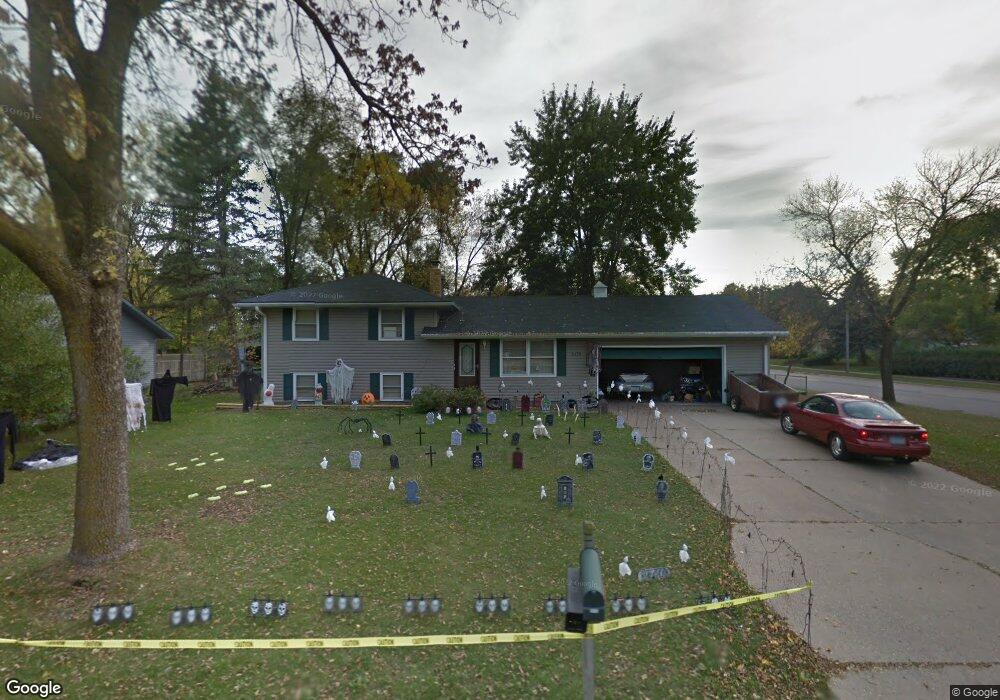
2472 103rd Ave NW Coon Rapids, MN 55433
Estimated Value: $297,000 - $306,000
3
Beds
1
Bath
960
Sq Ft
$315/Sq Ft
Est. Value
About This Home
This home is located at 2472 103rd Ave NW, Coon Rapids, MN 55433 and is currently estimated at $302,446, approximately $315 per square foot. 2472 103rd Ave NW is a home located in Anoka County with nearby schools including Lucile Bruner Elementary School, Mississippi Elementary School, and Laughlin Junior/Senior High School.
Ownership History
Date
Name
Owned For
Owner Type
Purchase Details
Closed on
Oct 8, 2015
Sold by
Ebi Holdings Inc
Bought by
Bolnick Jennifer
Current Estimated Value
Home Financials for this Owner
Home Financials are based on the most recent Mortgage that was taken out on this home.
Original Mortgage
$171,830
Interest Rate
4.25%
Mortgage Type
FHA
Purchase Details
Closed on
Jun 8, 2015
Sold by
Anoka County
Bought by
Ebi Holdings Inc
Purchase Details
Closed on
Mar 24, 2015
Sold by
Mccallson Barbara J
Bought by
Fishmls Realty Inc
Purchase Details
Closed on
Aug 29, 1999
Sold by
Elliott Theodore M and Elliott Susan M
Bought by
Mccallson Mark and Mccallson Barbara
Create a Home Valuation Report for This Property
The Home Valuation Report is an in-depth analysis detailing your home's value as well as a comparison with similar homes in the area
Home Values in the Area
Average Home Value in this Area
Purchase History
| Date | Buyer | Sale Price | Title Company |
|---|---|---|---|
| Bolnick Jennifer | $175,000 | North Title Inc | |
| Ebi Holdings Inc | $91,554 | North Title Inc | |
| Fishmls Realty Inc | -- | None Available | |
| Mccallson Mark | $124,744 | -- |
Source: Public Records
Mortgage History
| Date | Status | Borrower | Loan Amount |
|---|---|---|---|
| Previous Owner | Bolnick Jennifer | $171,830 |
Source: Public Records
Tax History Compared to Growth
Tax History
| Year | Tax Paid | Tax Assessment Tax Assessment Total Assessment is a certain percentage of the fair market value that is determined by local assessors to be the total taxable value of land and additions on the property. | Land | Improvement |
|---|---|---|---|---|
| 2025 | $2,577 | $259,400 | $90,000 | $169,400 |
| 2024 | $2,577 | $255,800 | $87,000 | $168,800 |
| 2023 | $2,254 | $255,700 | $83,000 | $172,700 |
| 2022 | $2,159 | $238,500 | $67,000 | $171,500 |
| 2021 | $2,109 | $205,600 | $67,000 | $138,600 |
| 2020 | $2,210 | $197,000 | $65,000 | $132,000 |
| 2019 | $1,995 | $197,600 | $62,000 | $135,600 |
| 2018 | $1,926 | $175,900 | $0 | $0 |
| 2017 | $1,591 | $166,000 | $0 | $0 |
| 2016 | $1,635 | $140,300 | $0 | $0 |
| 2015 | $1,775 | $140,300 | $46,000 | $94,300 |
| 2014 | -- | $119,000 | $35,200 | $83,800 |
Source: Public Records
Map
Nearby Homes
- 10309 Yukon St NW
- 10200 Mississippi Blvd NW
- 2633 103rd Ave NW
- 10136 Uplander St NW
- 10239 Raven St NW
- 10616 Arrowhead St NW
- 10648 Wren St NW
- 2001 103rd Ln NW
- 2201 108th Ave NW
- 2400 108th Ave NW
- 1900 Coon Rapids Blvd NW Unit 1
- 2721 109th Ave NW
- 5111 109th Ave N
- 2728 109th Ln NW
- 10583 Noble Cir N
- 2965 108th Ln NW
- 10509 Major Ave N
- 11208 Welcome Ave N
- 11000 Swallow St NW
- 11333 Welcome Ave N
- 2464 103rd Ave NW
- 10301 Xavis St NW
- 10237 Mississippi Blvd NW
- 2456 103rd Ave NW
- 2500 103rd Ave NW
- 10233 Mississippi Blvd NW
- 2465 103rd Ave NW
- 2501 103rd Ave NW
- 10229 Mississippi Blvd NW
- 10241 Mississippi Blvd NW
- 10309 Xavis St NW
- 2508 103rd Ave NW
- 2457 103rd Ave NW
- 2448 103rd Ave NW
- 2509 103rd Ave NW
- 10245 Mississippi Blvd NW
- 10317 Xavis St NW
- 10225 Mississippi Blvd NW
- 10308 Xavis St NW
- 2449 103rd Ave NW