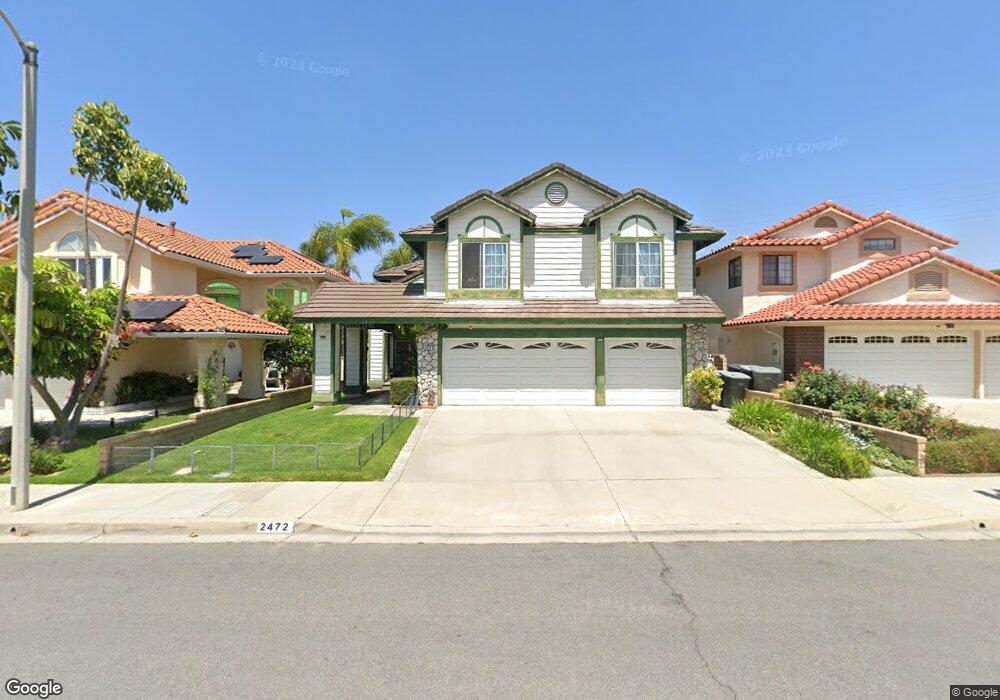
2472 Hawkwood Dr Chino Hills, CA 91709
North Chino Hills NeighborhoodEstimated Value: $1,296,901 - $1,437,000
5
Beds
3
Baths
2,935
Sq Ft
$468/Sq Ft
Est. Value
About This Home
This home is located at 2472 Hawkwood Dr, Chino Hills, CA 91709 and is currently estimated at $1,372,725, approximately $467 per square foot. 2472 Hawkwood Dr is a home located in San Bernardino County with nearby schools including Country Springs Elementary School, Canyon Hills Junior High School, and Ruben S. Ayala High School.
Ownership History
Date
Name
Owned For
Owner Type
Purchase Details
Closed on
Feb 22, 2022
Sold by
An-Tung Liang
Bought by
Liang Pei Lee
Current Estimated Value
Home Financials for this Owner
Home Financials are based on the most recent Mortgage that was taken out on this home.
Original Mortgage
$200,000
Outstanding Balance
$186,529
Interest Rate
3.92%
Mortgage Type
New Conventional
Estimated Equity
$1,186,196
Purchase Details
Closed on
Feb 14, 2022
Sold by
Lee Liang Pei
Bought by
Liang Pei Lee
Home Financials for this Owner
Home Financials are based on the most recent Mortgage that was taken out on this home.
Original Mortgage
$200,000
Outstanding Balance
$186,529
Interest Rate
3.92%
Mortgage Type
New Conventional
Estimated Equity
$1,186,196
Purchase Details
Closed on
Aug 1, 2006
Sold by
Liang An Tung
Bought by
Siang Pei Lee
Purchase Details
Closed on
Sep 23, 2005
Sold by
Siang Pei Lee
Bought by
Liang An Tung
Purchase Details
Closed on
Sep 22, 2005
Sold by
Siang Pei Lee
Bought by
Siang Pei Lee
Purchase Details
Closed on
Apr 9, 2001
Sold by
Siang Pei Lee
Bought by
Siang Pei Lee and The Pei Lee Siang Revocable Li
Create a Home Valuation Report for This Property
The Home Valuation Report is an in-depth analysis detailing your home's value as well as a comparison with similar homes in the area
Home Values in the Area
Average Home Value in this Area
Purchase History
| Date | Buyer | Sale Price | Title Company |
|---|---|---|---|
| Liang Pei Lee | -- | Ticor Title | |
| Liang Pei Lee | -- | Ticor Title | |
| Siang Pei Lee | -- | None Available | |
| Liang An Tung | -- | Chicago Title Co | |
| Siang Pei Lee | -- | Chicago Title Co | |
| Siang Pei Lee | -- | -- | |
| Siang Pei Lee | -- | -- |
Source: Public Records
Mortgage History
| Date | Status | Borrower | Loan Amount |
|---|---|---|---|
| Open | Liang Pei Lee | $200,000 |
Source: Public Records
Tax History Compared to Growth
Tax History
| Year | Tax Paid | Tax Assessment Tax Assessment Total Assessment is a certain percentage of the fair market value that is determined by local assessors to be the total taxable value of land and additions on the property. | Land | Improvement |
|---|---|---|---|---|
| 2025 | $6,744 | $582,621 | $201,106 | $381,515 |
| 2024 | $6,744 | $571,197 | $197,163 | $374,034 |
| 2023 | $6,570 | $559,997 | $193,297 | $366,700 |
| 2022 | $6,610 | $549,017 | $189,507 | $359,510 |
| 2021 | $6,491 | $538,252 | $185,791 | $352,461 |
| 2020 | $6,413 | $532,733 | $183,886 | $348,847 |
| 2019 | $6,310 | $522,287 | $180,280 | $342,007 |
| 2018 | $6,182 | $512,046 | $176,745 | $335,301 |
| 2017 | $6,080 | $502,005 | $173,279 | $328,726 |
| 2016 | $6,291 | $492,161 | $169,881 | $322,280 |
| 2015 | $6,175 | $484,768 | $167,329 | $317,439 |
| 2014 | $6,062 | $475,272 | $164,051 | $311,221 |
Source: Public Records
Map
Nearby Homes
- 14171 Shoreline Dr
- 13593 Monte Royale Dr
- 14155 Applegate Ln
- 2460 Windmill Creek Rd
- 13663 Monteverde Dr
- 2286 Black Pine Rd
- 13470 Palamos Place
- 3056 Giant Forest Loop
- 13530 Tawny Ln
- 14726 Moon Crest Ln Unit E
- 14748 Moon Crest Ln Unit E
- 2515 Pointe Coupee
- 2432 Moon Dust Dr Unit B
- 2308 Wandering Ridge Dr
- 2509 Moon Dust Dr Unit A
- 3248 Giant Forest Loop
- 13255 Sonrisa Dr
- 2155 Camino Largo Dr
- 1839 Nordic Ave
- 13149 Pinnacle Ct
- 2464 Hawkwood Dr
- 2480 Hawkwood Dr
- 14020 Falcon Ridge Dr
- 2456 Hawkwood Dr
- 2448 Hawkwood Dr
- 14012 Falcon Ridge Dr
- 2477 Hawkwood Dr
- 2481 Hawkwood Dr
- 2440 Hawkwood Dr
- 2469 Hawkwood Dr
- 14037 Falcon Ridge Dr
- 2485 Hawkwood Dr
- 14029 Falcon Ridge Dr
- 14045 Falcon Ridge Dr
- 14021 Falcon Ridge Dr
- 2489 Hawkwood Dr
- 14053 Falcon Ridge Dr
- 2465 Hawkwood Dr
- 2438 Hawkwood Dr
- 2453 Hawkwood Dr