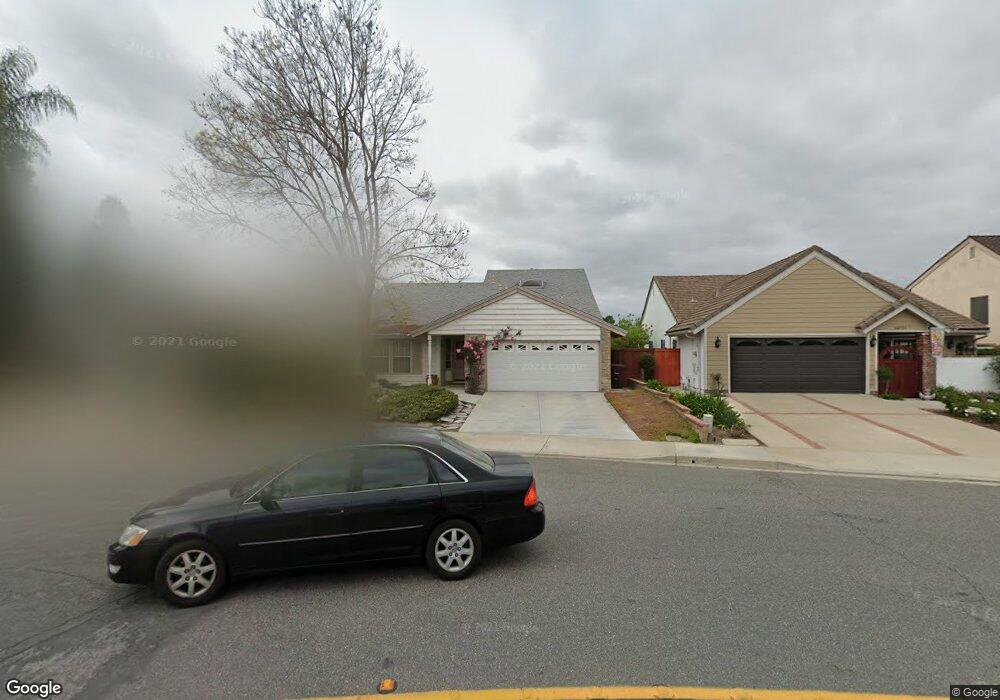
24721 Georgia Sue Laguna Hills, CA 92653
Estimated Value: $1,349,960 - $1,575,000
5
Beds
3
Baths
2,263
Sq Ft
$653/Sq Ft
Est. Value
About This Home
This home is located at 24721 Georgia Sue, Laguna Hills, CA 92653 and is currently estimated at $1,477,990, approximately $653 per square foot. 24721 Georgia Sue is a home located in Orange County with nearby schools including Lomarena Elementary School, Los Alisos Intermediate School, and Laguna Hills High.
Ownership History
Date
Name
Owned For
Owner Type
Purchase Details
Closed on
Apr 1, 2004
Sold by
Finley Warren Telford
Bought by
Pscheidt Edward A
Current Estimated Value
Purchase Details
Closed on
Aug 20, 1996
Sold by
Finley Warren and Finley Marcia R
Bought by
Finley Warren Telford and Finley Childrens Trust
Purchase Details
Closed on
Mar 11, 1996
Sold by
Emc Mtg Corp
Bought by
Finley Warren and Finley Marcia R
Home Financials for this Owner
Home Financials are based on the most recent Mortgage that was taken out on this home.
Original Mortgage
$188,000
Interest Rate
6.98%
Purchase Details
Closed on
Nov 27, 1995
Sold by
Great Western Bank
Bought by
Emc Mtg Corp
Purchase Details
Closed on
Sep 21, 1995
Sold by
Vanvannguyen Khanh Van and Nguyen Ngoc Thu
Bought by
Great Western Bank
Create a Home Valuation Report for This Property
The Home Valuation Report is an in-depth analysis detailing your home's value as well as a comparison with similar homes in the area
Home Values in the Area
Average Home Value in this Area
Purchase History
| Date | Buyer | Sale Price | Title Company |
|---|---|---|---|
| Pscheidt Edward A | -- | -- | |
| Finley Warren Telford | -- | -- | |
| Finley Warren | $235,000 | Chicago Title Co | |
| Emc Mtg Corp | $175,000 | Chicago Title Co | |
| Great Western Bank | $168,000 | Orange Coast Title |
Source: Public Records
Mortgage History
| Date | Status | Borrower | Loan Amount |
|---|---|---|---|
| Previous Owner | Finley Warren | $188,000 |
Source: Public Records
Tax History Compared to Growth
Tax History
| Year | Tax Paid | Tax Assessment Tax Assessment Total Assessment is a certain percentage of the fair market value that is determined by local assessors to be the total taxable value of land and additions on the property. | Land | Improvement |
|---|---|---|---|---|
| 2025 | $8,776 | $875,816 | $663,568 | $212,248 |
| 2024 | $8,776 | $858,644 | $650,557 | $208,087 |
| 2023 | $8,568 | $841,808 | $637,801 | $204,007 |
| 2022 | $8,414 | $825,302 | $625,295 | $200,007 |
| 2021 | $8,245 | $809,120 | $613,034 | $196,086 |
| 2020 | $8,171 | $800,824 | $606,748 | $194,076 |
| 2019 | $8,007 | $785,122 | $594,851 | $190,271 |
| 2018 | $7,856 | $769,728 | $583,187 | $186,541 |
| 2017 | $7,394 | $725,000 | $560,541 | $164,459 |
| 2016 | $7,417 | $725,000 | $560,541 | $164,459 |
| 2015 | $7,439 | $725,000 | $563,404 | $161,596 |
| 2014 | $6,943 | $678,374 | $516,778 | $161,596 |
Source: Public Records
Map
Nearby Homes
- 24641 Paige Cir
- 24861 Camberwell St
- 24882 Avenida Avalon
- 660 Avenida Sevilla Unit P
- 25061 Silverleaf Ln
- 161 Avenida Majorca Unit C
- 661 Avenida Sevilla Unit O
- 199 Avenida Majorca Unit C
- 141 Avenida Majorca Unit B
- 783 Via Los Altos Unit A
- 662 Via Los Altos Unit N
- 662 Via Los Altos Unit P
- 214 Avenida Majorca Unit A
- 683 Via Alhambra Unit N
- 207 Avenida Majorca Unit A
- 24252 Palmek Cir
- 629 Avenida Sevilla Unit P
- 224 Avenida Majorca Unit A
- 665 Via Los Altos Unit A
- 620 Avenida Sevilla Unit N
- 24731 Georgia Sue
- 24711 Georgia Sue
- 24741 Georgia Sue
- 24745 Georgia Sue
- 24682 Jorie Dr
- 24751 Georgia Sue
- 24692 Jorie Dr
- 24651 Kim Cir
- 24761 Georgia Sue
- 24702 Jorie Dr
- 24661 Kim Cir
- 24671 Kim Cir
- 24771 Georgia Sue
- 24712 Jorie Dr
- 24681 Kim Cir
- 24646 Kim Cir
- 24781 Georgia Sue
- 24722 Jorie Dr
- 24592 Christina Ct
- 24652 Kim Cir