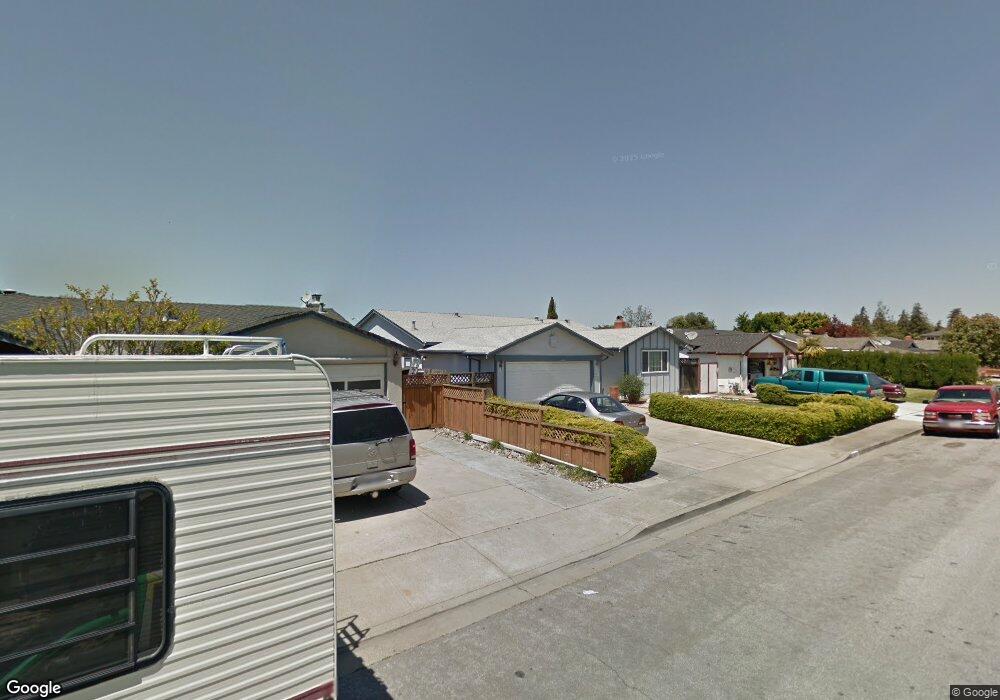
2474 Shield Dr Union City, CA 94587
Estimated Value: $1,271,469 - $1,371,000
4
Beds
2
Baths
1,566
Sq Ft
$843/Sq Ft
Est. Value
About This Home
This home is located at 2474 Shield Dr, Union City, CA 94587 and is currently estimated at $1,320,117, approximately $842 per square foot. 2474 Shield Dr is a home located in Alameda County with nearby schools including Tom Kitayama Elementary School, Cesar Chavez Middle School, and James Logan High School.
Ownership History
Date
Name
Owned For
Owner Type
Purchase Details
Closed on
Jun 19, 2014
Sold by
Vu Tacita Sze Pue
Bought by
Vu Tiffany Sze Mun
Current Estimated Value
Purchase Details
Closed on
Dec 10, 2009
Sold by
Garcia Segundo S and Garcia Hilda
Bought by
Pue Vu Tiffany Sze Mun and Pue Vu Tacita Sze
Purchase Details
Closed on
May 23, 2001
Sold by
Garcia Segundo S and Garcia Evarado M
Bought by
Garcia Segundo S and Garcia Hilda
Home Financials for this Owner
Home Financials are based on the most recent Mortgage that was taken out on this home.
Original Mortgage
$218,700
Interest Rate
7.14%
Purchase Details
Closed on
Oct 8, 1999
Sold by
Garcia Denise I
Bought by
Garcia Segundo S and Garcia Evarado M
Purchase Details
Closed on
Mar 16, 1999
Sold by
Garcia Hilda J
Bought by
Garcia Segundo S and Garcia Evarado M
Create a Home Valuation Report for This Property
The Home Valuation Report is an in-depth analysis detailing your home's value as well as a comparison with similar homes in the area
Home Values in the Area
Average Home Value in this Area
Purchase History
| Date | Buyer | Sale Price | Title Company |
|---|---|---|---|
| Vu Tiffany Sze Mun | $261,000 | None Available | |
| Pue Vu Tiffany Sze Mun | $429,000 | First American Title Company | |
| Garcia Segundo S | $108,500 | First American Title | |
| Garcia Segundo S | -- | North American Title Co | |
| Garcia Segundo S | -- | North American Title Co |
Source: Public Records
Mortgage History
| Date | Status | Borrower | Loan Amount |
|---|---|---|---|
| Previous Owner | Garcia Segundo S | $218,700 |
Source: Public Records
Tax History
| Year | Tax Paid | Tax Assessment Tax Assessment Total Assessment is a certain percentage of the fair market value that is determined by local assessors to be the total taxable value of land and additions on the property. | Land | Improvement |
|---|---|---|---|---|
| 2025 | $9,390 | $641,540 | $192,462 | $449,078 |
| 2024 | $9,390 | $628,963 | $188,689 | $440,274 |
| 2023 | $9,086 | $616,633 | $184,990 | $431,643 |
| 2022 | $8,926 | $604,544 | $181,363 | $423,181 |
| 2021 | $8,728 | $592,694 | $177,808 | $414,886 |
| 2020 | $8,557 | $586,620 | $175,986 | $410,634 |
| 2019 | $8,639 | $575,120 | $172,536 | $402,584 |
| 2018 | $8,440 | $563,847 | $169,154 | $394,693 |
| 2017 | $8,240 | $552,793 | $165,838 | $386,955 |
| 2016 | $7,943 | $541,956 | $162,587 | $379,369 |
| 2015 | $7,793 | $533,818 | $160,145 | $373,673 |
| 2014 | $6,640 | $451,727 | $135,518 | $316,209 |
Source: Public Records
Map
Nearby Homes
- 32262 Crest Ln
- 2447 Douglas St
- 2473 Balmoral St
- 2444 Douglas St
- 2449 Almaden Blvd
- 2432 Balmoral St
- 32368 Derby St
- 32224 Sloccum Ct
- 32651 Singh Cir
- 32608 Brenda Way Unit 4
- 31262 San Andreas Dr
- 32625 Brenda Way Unit 1
- 32656 Brenda Way Unit 2
- 31286 Santa Rita Way
- 2676 Great Arbor Way Unit 45
- 3020 San Andreas Dr
- 32471 Lake Ree St
- 2826 Montair Way
- 31391 San Diego Ct
- 3168 Courthouse Dr
- 2472 Shield Dr
- 2476 Shield Dr
- 2475 Cameron Dr
- 2473 Cameron Dr
- 2470 Shield Dr
- 2478 Shield Dr
- 2477 Cameron Dr
- 2471 Cameron Dr
- 2475 Shield Dr
- 2473 Shield Dr
- 2477 Shield Dr
- 2468 Shield Dr
- 2480 Shield Dr
- 2471 Shield Dr
- 2479 Shield Dr
- 2469 Cameron Dr
- 32282 Devonshire St
- 2469 Shield Dr
- 2481 Shield Dr
- 2466 Shield Dr
Your Personal Tour Guide
Ask me questions while you tour the home.