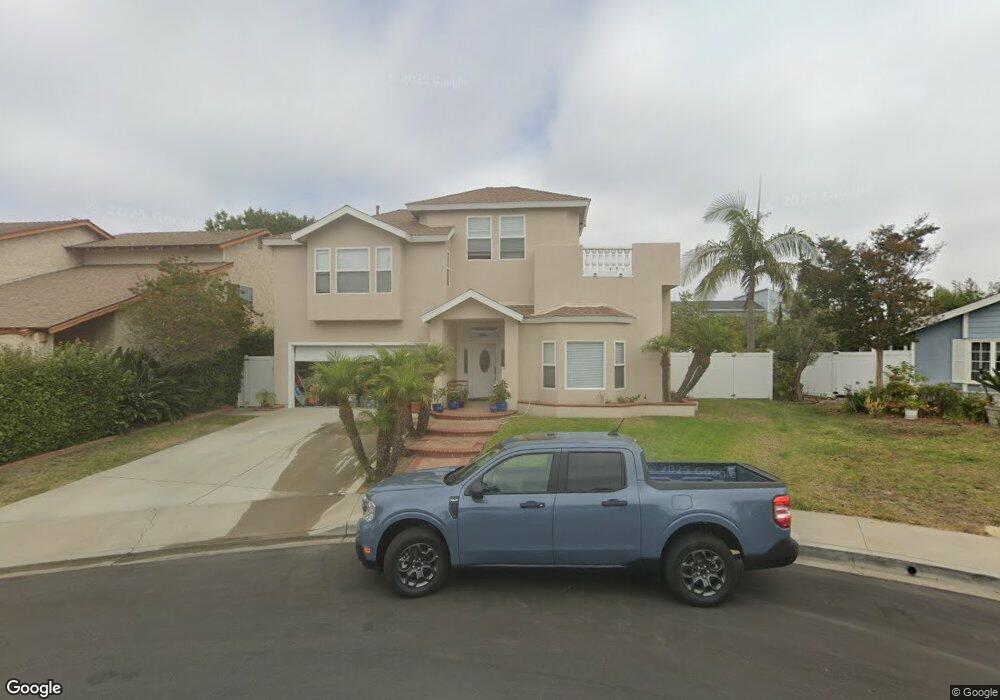
24741 Camarillo St Dana Point, CA 92629
Dana Hills NeighborhoodEstimated Value: $1,647,413 - $2,145,000
4
Beds
3
Baths
2,248
Sq Ft
$825/Sq Ft
Est. Value
About This Home
This home is located at 24741 Camarillo St, Dana Point, CA 92629 and is currently estimated at $1,853,603, approximately $824 per square foot. 24741 Camarillo St is a home located in Orange County with nearby schools including John Malcom Elementary School, Marco Forster Middle School, and Dana Hills High School.
Ownership History
Date
Name
Owned For
Owner Type
Purchase Details
Closed on
Mar 27, 2013
Sold by
Castro David and Castro Susan
Bought by
Castro David Michael and Castro Susan Espenilla
Current Estimated Value
Purchase Details
Closed on
Sep 17, 2011
Sold by
Castro David M and Castro Susan E
Bought by
Castro David and Castro Susan
Home Financials for this Owner
Home Financials are based on the most recent Mortgage that was taken out on this home.
Original Mortgage
$228,000
Interest Rate
4.09%
Mortgage Type
New Conventional
Purchase Details
Closed on
Oct 8, 1997
Sold by
Macinnes James D and Macinnes Christina Innes
Bought by
Castro David M and Castro Susan E
Home Financials for this Owner
Home Financials are based on the most recent Mortgage that was taken out on this home.
Original Mortgage
$160,000
Interest Rate
7.49%
Create a Home Valuation Report for This Property
The Home Valuation Report is an in-depth analysis detailing your home's value as well as a comparison with similar homes in the area
Home Values in the Area
Average Home Value in this Area
Purchase History
| Date | Buyer | Sale Price | Title Company |
|---|---|---|---|
| Castro David Michael | -- | None Available | |
| Castro David | -- | Orange Coast Title Company O | |
| Castro David M | $175,000 | Commonwealth Land Title |
Source: Public Records
Mortgage History
| Date | Status | Borrower | Loan Amount |
|---|---|---|---|
| Closed | Castro David | $228,000 | |
| Closed | Castro David M | $160,000 |
Source: Public Records
Tax History Compared to Growth
Tax History
| Year | Tax Paid | Tax Assessment Tax Assessment Total Assessment is a certain percentage of the fair market value that is determined by local assessors to be the total taxable value of land and additions on the property. | Land | Improvement |
|---|---|---|---|---|
| 2025 | $6,129 | $390,199 | $189,904 | $200,295 |
| 2024 | $6,129 | $382,549 | $186,181 | $196,368 |
| 2023 | $5,935 | $375,049 | $182,531 | $192,518 |
| 2022 | $5,534 | $367,696 | $178,952 | $188,744 |
| 2021 | $5,477 | $360,487 | $175,443 | $185,044 |
| 2020 | $5,196 | $356,791 | $173,644 | $183,147 |
| 2019 | $5,187 | $349,796 | $170,240 | $179,556 |
| 2018 | $4,883 | $342,938 | $166,902 | $176,036 |
| 2017 | $4,646 | $336,214 | $163,629 | $172,585 |
| 2016 | $4,480 | $329,622 | $160,421 | $169,201 |
| 2015 | $4,067 | $324,671 | $158,011 | $166,660 |
| 2014 | $4,005 | $318,312 | $154,916 | $163,396 |
Source: Public Records
Map
Nearby Homes
- 33144 Ocean Ridge
- 33121 Ocean Ridge
- 33371 Cheltam Way Unit 3
- 33371 Cheltam Way Unit 2
- 24871 Sherwood Way
- 33551 Sandcastle Ct
- 24965 Seagate Dr
- 33616 Rising Tide Ct
- 33611 Dana Vista Dr Unit 31
- 24716 Morning Star Ln Unit 362
- 33621 Blue Lantern St
- 24096 Paseo Corona
- 24616 Polaris Dr Unit 272
- 24092 Paseo Corona
- 33586 Circula Corona
- 24512 Polaris Dr Unit 340
- 33671 Granada Dr Unit 5
- 24400 Alta Vista Dr
- 33586 Via Corvalian Unit 23
- 24432 Moonfire Dr
- 24735 Camarillo St
- 24745 Camarillo St
- 24731 Camarillo St
- 24751 Camarillo St
- 24725 Camarillo St
- 24742 Camarillo St
- 24732 Camarillo St
- 24746 Camarillo St
- 24722 Camarillo St
- 24721 Camarillo St
- 33276 Christina Dr
- 33262 Christina Dr
- 24715 Camarillo St
- 33292 Christina Dr
- 33252 Christina Dr
- 24711 Camarillo St
- 33242 Christina Dr
- 33331 B #2 Nottingham Way Unit 2
- 33331 Nottingham Way Unit B
- 33331 Nottingham Way Unit 1