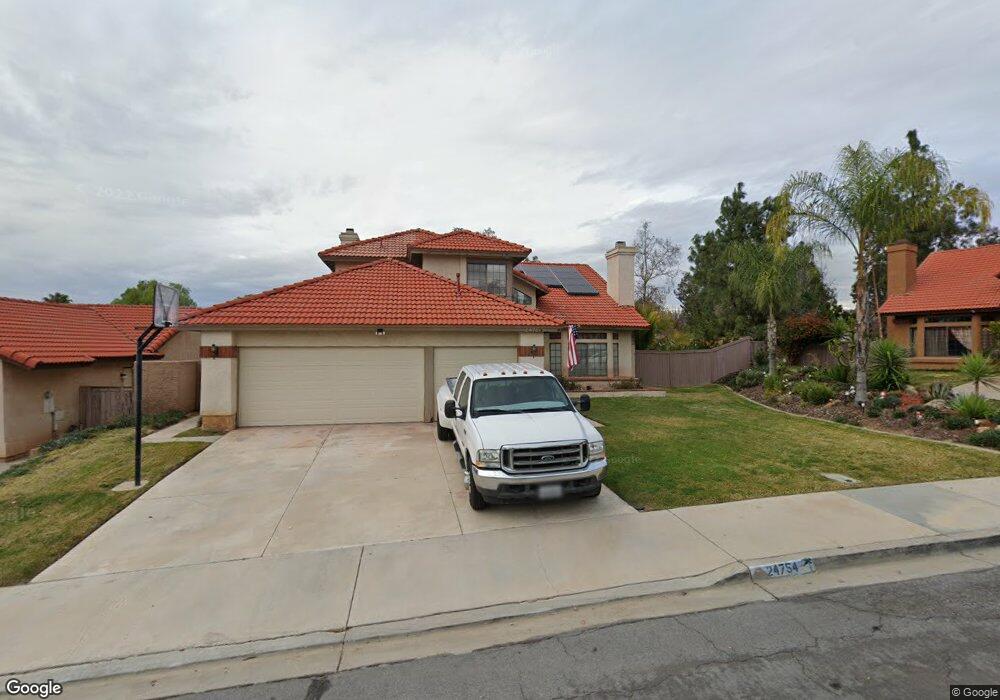
24754 Thornberry Cir Moreno Valley, CA 92557
North Moreno Valley NeighborhoodEstimated Value: $601,875 - $659,000
5
Beds
3
Baths
2,363
Sq Ft
$268/Sq Ft
Est. Value
About This Home
This home is located at 24754 Thornberry Cir, Moreno Valley, CA 92557 and is currently estimated at $632,969, approximately $267 per square foot. 24754 Thornberry Cir is a home located in Riverside County with nearby schools including Sugar Hill Elementary School, Palm Middle School, and Canyon Springs High School.
Ownership History
Date
Name
Owned For
Owner Type
Purchase Details
Closed on
May 19, 2025
Sold by
Mortati Denise P
Bought by
Denise P Mortati Living Trust and Mortati
Current Estimated Value
Purchase Details
Closed on
May 24, 2007
Sold by
Mortati John R
Bought by
Mortati Denise P
Home Financials for this Owner
Home Financials are based on the most recent Mortgage that was taken out on this home.
Original Mortgage
$218,000
Interest Rate
6.14%
Mortgage Type
New Conventional
Purchase Details
Closed on
Oct 20, 1994
Sold by
Mortati Anna Lynda
Bought by
Mortati John R
Home Financials for this Owner
Home Financials are based on the most recent Mortgage that was taken out on this home.
Original Mortgage
$124,018
Interest Rate
8.91%
Mortgage Type
FHA
Purchase Details
Closed on
Aug 30, 1994
Sold by
Jun Young Kon and Chong Sun Kim
Bought by
Mortati John R
Home Financials for this Owner
Home Financials are based on the most recent Mortgage that was taken out on this home.
Original Mortgage
$124,018
Interest Rate
8.91%
Mortgage Type
FHA
Create a Home Valuation Report for This Property
The Home Valuation Report is an in-depth analysis detailing your home's value as well as a comparison with similar homes in the area
Home Values in the Area
Average Home Value in this Area
Purchase History
| Date | Buyer | Sale Price | Title Company |
|---|---|---|---|
| Denise P Mortati Living Trust | -- | None Listed On Document | |
| Mortati Denise P | $424,000 | First American Title Company | |
| Mortati John R | -- | Commonwealth Land Title Co | |
| Mortati John R | $125,000 | Commonwealth Land Title Co |
Source: Public Records
Mortgage History
| Date | Status | Borrower | Loan Amount |
|---|---|---|---|
| Previous Owner | Mortati Denise P | $218,000 | |
| Previous Owner | Mortati John R | $124,018 |
Source: Public Records
Tax History Compared to Growth
Tax History
| Year | Tax Paid | Tax Assessment Tax Assessment Total Assessment is a certain percentage of the fair market value that is determined by local assessors to be the total taxable value of land and additions on the property. | Land | Improvement |
|---|---|---|---|---|
| 2025 | $2,466 | $218,321 | $75,568 | $142,753 |
| 2023 | $2,466 | $209,845 | $72,635 | $137,210 |
| 2022 | $2,371 | $205,731 | $71,211 | $134,520 |
| 2021 | $2,326 | $201,698 | $69,815 | $131,883 |
| 2020 | $2,301 | $199,631 | $69,100 | $130,531 |
| 2019 | $2,262 | $195,718 | $67,746 | $127,972 |
| 2018 | $2,217 | $191,881 | $66,418 | $125,463 |
| 2017 | $2,168 | $188,119 | $65,116 | $123,003 |
| 2016 | $2,145 | $184,432 | $63,840 | $120,592 |
| 2015 | $2,192 | $181,664 | $62,882 | $118,782 |
| 2014 | $2,044 | $178,107 | $61,651 | $116,456 |
Source: Public Records
Map
Nearby Homes
- 24735 Thornberry Cir
- 24553 Wild Calla Dr
- 24461 Willow Run Rd
- 24884 Miners View Ln
- 24321 Barley Rd
- 24472 Old Country Rd
- 24819 Skyland Dr
- 10529 Cloud Haven Dr
- 24785 El Dorado Dr
- 10479 Sagecrest Dr
- 10429 Cloud Haven Dr
- 25060 Jaclyn Ave
- 24316 Chippewa Trail
- 24321 Rimview Rd
- 24309 Rimview Rd
- 25240 Pico Vista Way
- 10380 Prospector Ln
- 24720 Sundial Way
- 25228 Jaclyn Ave
- 24118 Forsyte St
- 24746 Thornberry Cir
- 24766 Thornberry Cir
- 24769 Thornberry Cir
- 24743 Thornberry Cir
- 24755 Thornberry Cir
- 24719 Wild Calla Dr
- 24767 Thornberry Cir
- 24728 Thornberry Cir
- 24701 Wild Calla Dr
- 10808 Hill Grass Dr
- 24718 Thornberry Cir
- 24725 Thornberry Cir
- 24770 Plumtree Ct
- 24758 Plumtree Ct
- 24780 Plumtree Ct
- 24681 Wild Calla Dr
- 24798 Plumtree Ct
- 24716 Wild Calla Dr
- 10791 Morning Ridge Dr
- 24671 Wild Calla Dr