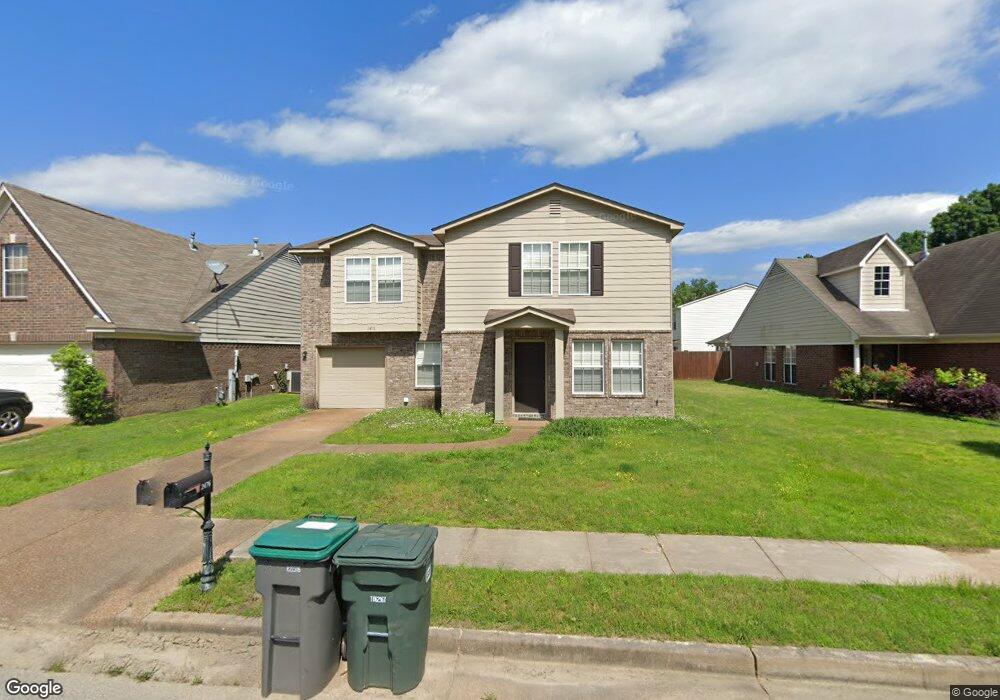
2476 Boxford Ln Cordova, TN 38016
Gray's Creek NeighborhoodEstimated Value: $235,000 - $265,000
3
Beds
3
Baths
1,798
Sq Ft
$141/Sq Ft
Est. Value
About This Home
This home is located at 2476 Boxford Ln, Cordova, TN 38016 and is currently estimated at $253,825, approximately $141 per square foot. 2476 Boxford Ln is a home located in Shelby County with nearby schools including Macon-Hall Elementary School, Mt. Pisgah Middle School, and Cordova High School.
Ownership History
Date
Name
Owned For
Owner Type
Purchase Details
Closed on
Jun 22, 2010
Sold by
Vintage Homes Llc
Bought by
Smith Michelle D
Current Estimated Value
Home Financials for this Owner
Home Financials are based on the most recent Mortgage that was taken out on this home.
Original Mortgage
$103,298
Outstanding Balance
$70,175
Interest Rate
5.25%
Mortgage Type
FHA
Estimated Equity
$183,650
Purchase Details
Closed on
May 5, 2010
Sold by
Clm Llc
Bought by
Vintage Homes Llc
Home Financials for this Owner
Home Financials are based on the most recent Mortgage that was taken out on this home.
Original Mortgage
$103,298
Outstanding Balance
$70,175
Interest Rate
5.25%
Mortgage Type
FHA
Estimated Equity
$183,650
Purchase Details
Closed on
Jun 29, 2009
Sold by
First Tennessee Bank National Associatio
Bought by
Clm Llc
Purchase Details
Closed on
Feb 28, 2008
Sold by
Reeves Williams Llc
Bought by
First Tennessee Bank Na
Create a Home Valuation Report for This Property
The Home Valuation Report is an in-depth analysis detailing your home's value as well as a comparison with similar homes in the area
Home Values in the Area
Average Home Value in this Area
Purchase History
| Date | Buyer | Sale Price | Title Company |
|---|---|---|---|
| Smith Michelle D | $104,690 | Multiple | |
| Vintage Homes Llc | $13,500 | None Available | |
| Clm Llc | $412,500 | Smart Title & Settlemont Ser | |
| First Tennessee Bank Na | $1,281,196 | None Available |
Source: Public Records
Mortgage History
| Date | Status | Borrower | Loan Amount |
|---|---|---|---|
| Open | Smith Michelle D | $103,298 | |
| Previous Owner | Vintage Homes Llc | $83,752 |
Source: Public Records
Tax History Compared to Growth
Tax History
| Year | Tax Paid | Tax Assessment Tax Assessment Total Assessment is a certain percentage of the fair market value that is determined by local assessors to be the total taxable value of land and additions on the property. | Land | Improvement |
|---|---|---|---|---|
| 2025 | $1,648 | $68,450 | $13,250 | $55,200 |
| 2024 | $1,648 | $48,600 | $8,750 | $39,850 |
| 2023 | $2,961 | $48,600 | $8,750 | $39,850 |
| 2022 | $2,961 | $48,600 | $8,750 | $39,850 |
| 2021 | $2,995 | $48,600 | $8,750 | $39,850 |
| 2020 | $2,442 | $33,700 | $8,750 | $24,950 |
| 2019 | $2,442 | $33,700 | $8,750 | $24,950 |
| 2018 | $2,442 | $33,700 | $8,750 | $24,950 |
| 2017 | $1,385 | $33,700 | $8,750 | $24,950 |
| 2016 | $1,303 | $29,825 | $0 | $0 |
| 2014 | $1,303 | $29,825 | $0 | $0 |
Source: Public Records
Map
Nearby Homes
- 10329 Cottage Oaks Dr
- 2644 Plum Creek Dr
- 2638 Wood Sage Dr
- 10174 Old Well Terrace
- 10206 Evening Hill Dr
- 11257 U S Highway 64
- 2756 Maggie Woods Place
- 0000 U S Highway 64
- 000 U S Highway 64
- 9769 Misty Pine Dr
- 9960 Oban Dr
- 10454 Latting Rd
- 9977 Woodland Fern Dr
- 2725 Morning Sun Rd
- 9744 N Bloomington Cir
- 9931 Chivas Dr
- 2003 S Bend Dr
- 3082 Woodland Crest Dr
- 1898 Glen Turret Dr
- 1977 Rochelle Ln
- 2466 Boxford Ln
- 2482 Boxford Ln
- 10216 Cottage Farms Dr
- 2488 Boxford Ln
- 10219 Cottage Oaks Cove
- 2475 Boxford Ln
- 10220 Cottage Farms Dr
- 2494 Boxford Ln
- 10213 Cottage Farms Dr
- 2481 Boxford Ln
- 2469 Boxford Ln
- 10223 Cottage Oaks Cove
- 10224 Cottage Farms Dr
- 2487 Boxford Ln
- 2463 Boxford Ln
- 2493 Boxford Ln
- 10209 Cottage Farms Dr
- 10221 Cottage Farms Dr
- 10203 Cottage Farms Dr
- 2500 Boxford Ln