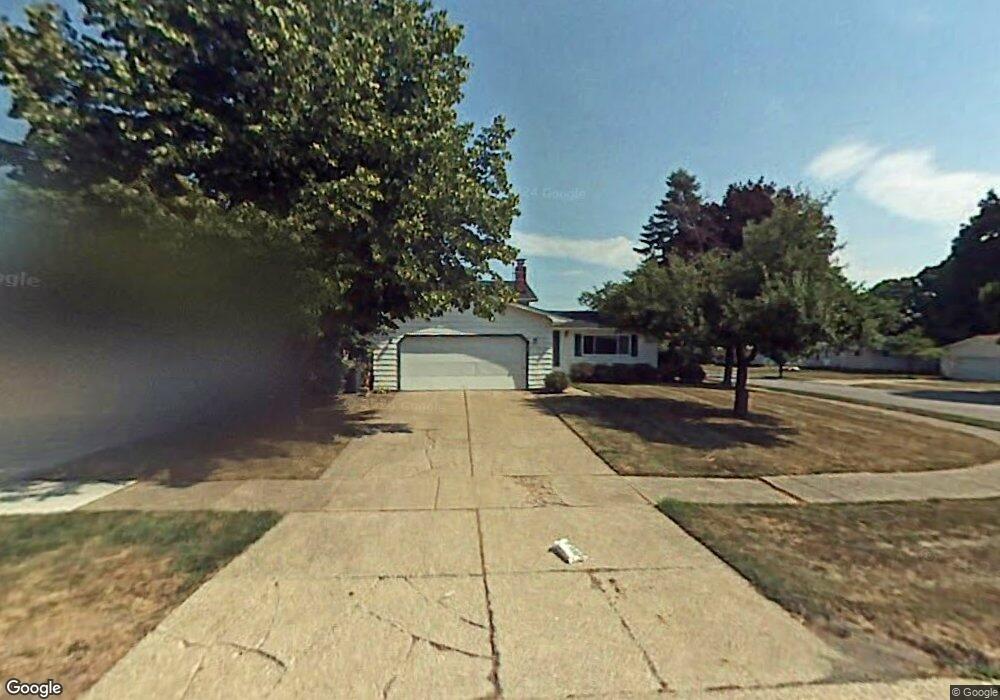
2476 Nottingham Dr Cleveland, OH 44134
Estimated Value: $252,000 - $262,000
3
Beds
1
Bath
1,584
Sq Ft
$163/Sq Ft
Est. Value
About This Home
This home is located at 2476 Nottingham Dr, Cleveland, OH 44134 and is currently estimated at $257,968, approximately $162 per square foot. 2476 Nottingham Dr is a home located in Cuyahoga County with nearby schools including Dentzler Elementary School, Normandy High School, and Hillside Middle School.
Ownership History
Date
Name
Owned For
Owner Type
Purchase Details
Closed on
Mar 13, 2008
Sold by
Harasimchuk Peter and Harasimchuk Victoria R
Bought by
Harasimchuk Stephen P
Current Estimated Value
Home Financials for this Owner
Home Financials are based on the most recent Mortgage that was taken out on this home.
Original Mortgage
$104,000
Outstanding Balance
$64,825
Interest Rate
5.75%
Mortgage Type
Purchase Money Mortgage
Estimated Equity
$193,143
Purchase Details
Closed on
Aug 5, 2003
Sold by
Harasimchuk Peter
Bought by
Harasimchuk Peter and Harasimchuk Victoria R
Purchase Details
Closed on
Apr 17, 1984
Sold by
Lallo Gloria L
Bought by
Harasimchuk Peter
Purchase Details
Closed on
Feb 6, 1979
Sold by
Lallo Michael J and Lallo Gloria L
Bought by
Lallo Gloria L
Purchase Details
Closed on
Jan 1, 1975
Bought by
Lallo Michael J and Lallo Gloria L
Create a Home Valuation Report for This Property
The Home Valuation Report is an in-depth analysis detailing your home's value as well as a comparison with similar homes in the area
Home Values in the Area
Average Home Value in this Area
Purchase History
| Date | Buyer | Sale Price | Title Company |
|---|---|---|---|
| Harasimchuk Stephen P | $130,000 | Real Estate Title | |
| Harasimchuk Peter | -- | -- | |
| Harasimchuk Peter | $62,000 | -- | |
| Lallo Gloria L | -- | -- | |
| Lallo Michael J | -- | -- |
Source: Public Records
Mortgage History
| Date | Status | Borrower | Loan Amount |
|---|---|---|---|
| Open | Harasimchuk Stephen P | $104,000 |
Source: Public Records
Tax History Compared to Growth
Tax History
| Year | Tax Paid | Tax Assessment Tax Assessment Total Assessment is a certain percentage of the fair market value that is determined by local assessors to be the total taxable value of land and additions on the property. | Land | Improvement |
|---|---|---|---|---|
| 2024 | $4,677 | $78,015 | $14,525 | $63,490 |
| 2023 | $3,955 | $56,460 | $11,900 | $44,560 |
| 2022 | $3,921 | $56,460 | $11,900 | $44,560 |
| 2021 | $4,036 | $56,460 | $11,900 | $44,560 |
| 2020 | $3,826 | $47,460 | $10,010 | $37,450 |
| 2019 | $3,677 | $135,600 | $28,600 | $107,000 |
| 2018 | $3,700 | $47,460 | $10,010 | $37,450 |
| 2017 | $3,555 | $42,560 | $9,240 | $33,320 |
| 2016 | $3,533 | $42,560 | $9,240 | $33,320 |
| 2015 | $3,474 | $42,560 | $9,240 | $33,320 |
| 2014 | $3,474 | $43,890 | $9,520 | $34,370 |
Source: Public Records
Map
Nearby Homes
- 2644 Nottingham Dr
- 7180 Marko Ln
- 3200 Dentzler Rd
- 2838 Marda Dr
- 3195 Marda Dr
- 1881 W Pleasant Valley Rd
- 3262 Marda Dr
- 3011 Klusner Ave
- 2800 Bonny Blvd
- 3610 Jeanne Dr
- 2406 Park Dr
- 2410 Park Dr
- 7030 Lyle Ave
- 7558 Pleasant View Dr
- 3018 Center Dr
- 1030 Guadalupe Dr
- 375 Hillside Rd
- 7004 Broadview Rd
- 2830 Brian Dr
- 3711 Klusner Ave
- 2502 Nottingham Dr
- 7230 Meadow Ln
- 2520 Nottingham Dr
- 7257 Meadow Ln
- 7245 Meadow Ln
- 7265 Meadow Ln
- 2538 Nottingham Dr
- 7231 Meadow Ln
- 2475 Robinhood Dr
- 7271 Meadow Ln
- 2479 Nottingham Dr
- 7225 Meadow Ln
- 2556 Nottingham Dr
- 2485 Robinhood Dr
- 2523 Nottingham Dr
- 7275 Meadow Ln
- 7212 Meadow Ln
- 7215 Meadow Ln
- 2541 Nottingham Dr
- 2574 Nottingham Dr