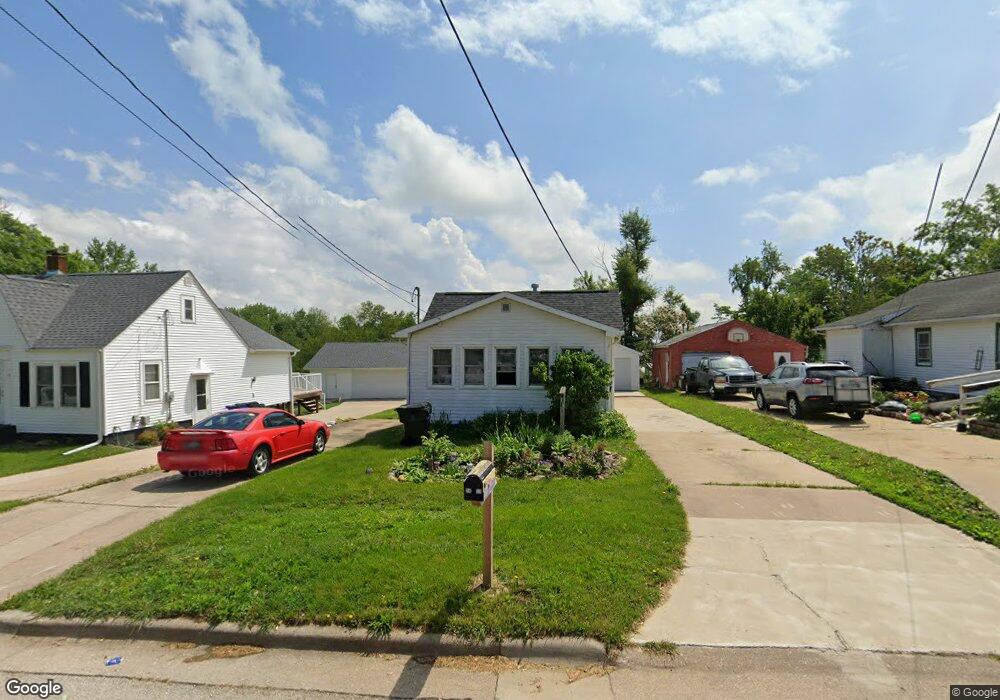
2477 Fruitland Blvd SW Cedar Rapids, IA 52404
Southwest Area NeighborhoodEstimated Value: $110,000 - $158,000
1
Bed
2
Baths
680
Sq Ft
$194/Sq Ft
Est. Value
About This Home
This home is located at 2477 Fruitland Blvd SW, Cedar Rapids, IA 52404 and is currently estimated at $131,592, approximately $193 per square foot. 2477 Fruitland Blvd SW is a home located in Linn County with nearby schools including Junction City Elementary School, Grant Elementary School, and Bruce Hall Day Treatment Center.
Ownership History
Date
Name
Owned For
Owner Type
Purchase Details
Closed on
Jul 7, 2011
Sold by
Devore Bobbi Jo and Sorensen Robert Dennis
Bought by
Devore Bobbi Jo
Current Estimated Value
Purchase Details
Closed on
Jul 14, 2004
Sold by
Devore Bobbi Jo
Bought by
Devore Bobbie Jo and Sorensen Robert Dennis
Home Financials for this Owner
Home Financials are based on the most recent Mortgage that was taken out on this home.
Original Mortgage
$56,000
Outstanding Balance
$28,342
Interest Rate
6.42%
Mortgage Type
New Conventional
Estimated Equity
$103,250
Purchase Details
Closed on
Jun 23, 1999
Sold by
Fields Douglas G and Fields Janice M
Bought by
Kaiser Kaleb K and Devore Bobbi Jo
Home Financials for this Owner
Home Financials are based on the most recent Mortgage that was taken out on this home.
Original Mortgage
$59,611
Interest Rate
7.15%
Mortgage Type
FHA
Create a Home Valuation Report for This Property
The Home Valuation Report is an in-depth analysis detailing your home's value as well as a comparison with similar homes in the area
Home Values in the Area
Average Home Value in this Area
Purchase History
| Date | Buyer | Sale Price | Title Company |
|---|---|---|---|
| Devore Bobbi Jo | -- | None Available | |
| Devore Bobbie Jo | -- | -- | |
| Kaiser Kaleb K | $60,000 | -- |
Source: Public Records
Mortgage History
| Date | Status | Borrower | Loan Amount |
|---|---|---|---|
| Open | Devore Bobbie Jo | $56,000 | |
| Closed | Kaiser Kaleb K | $59,611 |
Source: Public Records
Tax History Compared to Growth
Tax History
| Year | Tax Paid | Tax Assessment Tax Assessment Total Assessment is a certain percentage of the fair market value that is determined by local assessors to be the total taxable value of land and additions on the property. | Land | Improvement |
|---|---|---|---|---|
| 2025 | $1,504 | $119,800 | $31,500 | $88,300 |
| 2024 | $1,690 | $107,000 | $25,500 | $81,500 |
| 2023 | $1,690 | $95,500 | $25,500 | $70,000 |
| 2022 | $1,606 | $89,000 | $25,500 | $63,500 |
| 2021 | $1,552 | $86,500 | $25,500 | $61,000 |
| 2020 | $1,552 | $78,900 | $21,000 | $57,900 |
| 2019 | $1,514 | $78,800 | $18,000 | $60,800 |
| 2018 | $1,416 | $78,800 | $18,000 | $60,800 |
| 2017 | $1,553 | $72,200 | $18,000 | $54,200 |
| 2016 | $1,553 | $73,100 | $18,000 | $55,100 |
| 2015 | $1,569 | $73,718 | $18,000 | $55,718 |
| 2014 | $1,384 | $73,718 | $18,000 | $55,718 |
| 2013 | $1,350 | $73,718 | $18,000 | $55,718 |
Source: Public Records
Map
Nearby Homes
- 2321 Lauren Dr SW
- 2212 Deborah Dr SW
- 2601 Teresa Dr SW
- 2401 Victoria Dr SW
- 109 Evelyn Dr SW
- 51 29th Avenue Dr SW Unit D11
- 51 29th Avenue Dr SW Unit C22
- 2955 Bowling St SW Unit E238
- 3010 Bowling St SW
- 2818 Southland St SW
- 42 Park Village Ave SW
- 2937 Southland St SW
- 2021 Hamilton St SW
- 9 33rd Ave SW
- 3212 Southland St SW
- 90 29th Ave SW
- 186 22nd Ave SW
- 1756 Mallory St SW
- 0 Rompot St SE
- 148 33rd Ave SW
- 2473 Fruitland Blvd SW
- 2483 Fruitland Blvd SW
- Lot 64 Fruitland Blvd SW
- 2467 Fruitland Blvd SW
- 2493 Fruitland Blvd SW
- 2463 Fruitland Blvd SW
- 2487 Fruitland Blvd SW
- 2478 Fruitland Blvd SW
- 2492 Fruitland Blvd SW
- 2486 Fruitland Blvd SW
- 2457 Fruitland Blvd SW
- 2466 Fruitland Blvd SW
- 2462 Fruitland Blvd SW
- 2601 Fruitland Blvd SW
- 2453 Fruitland Blvd SW
- 2460 Fruitland Blvd SW
- 2472 Fruitland Blvd SW
- 2607 Fruitland Blvd SW
- 2452 Fruitland Blvd SW
- 2606 Fruitland Blvd SW