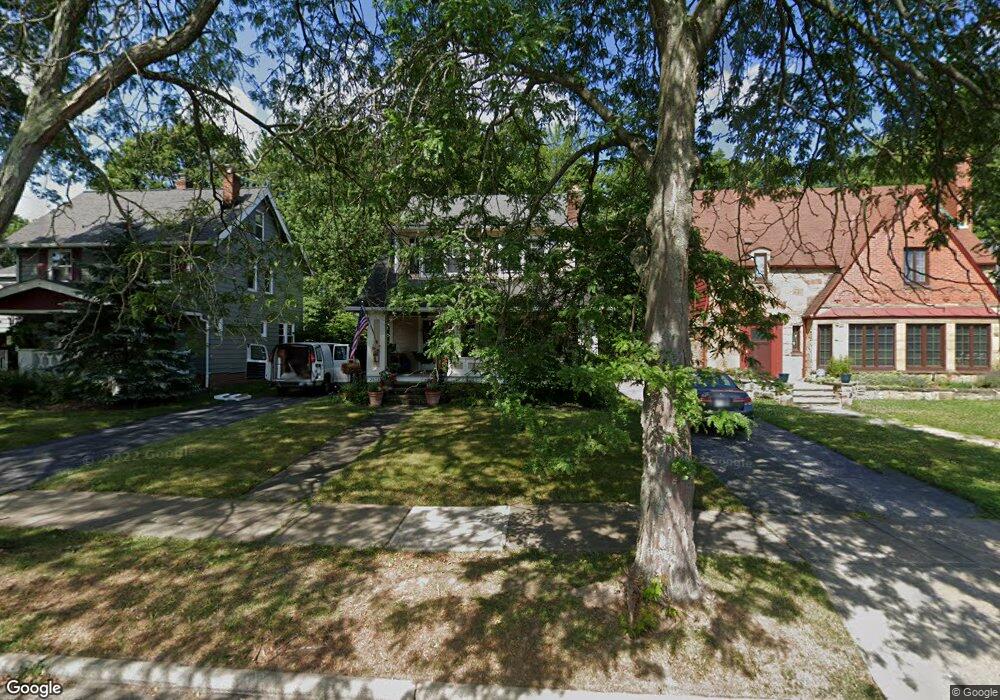
2478 Princeton Rd Cleveland, OH 44118
Estimated Value: $291,000 - $317,000
3
Beds
3
Baths
1,840
Sq Ft
$166/Sq Ft
Est. Value
About This Home
This home is located at 2478 Princeton Rd, Cleveland, OH 44118 and is currently estimated at $304,649, approximately $165 per square foot. 2478 Princeton Rd is a home located in Cuyahoga County with nearby schools including Canterbury Elementary School, Roxboro Middle School, and Cleveland Heights High School.
Ownership History
Date
Name
Owned For
Owner Type
Purchase Details
Closed on
Oct 28, 2000
Sold by
Kopczewski Kimberly G
Bought by
Hungate Katharine F and Hungate Rita G
Current Estimated Value
Home Financials for this Owner
Home Financials are based on the most recent Mortgage that was taken out on this home.
Original Mortgage
$127,480
Outstanding Balance
$47,242
Interest Rate
7.96%
Estimated Equity
$257,407
Purchase Details
Closed on
Nov 16, 1998
Sold by
Mehalko Scott K and Lum Megan A
Bought by
Kopczewski Gregory A and Kopczeswki Kimberly G
Home Financials for this Owner
Home Financials are based on the most recent Mortgage that was taken out on this home.
Original Mortgage
$121,600
Interest Rate
7.01%
Purchase Details
Closed on
Apr 30, 1992
Sold by
Snelling Barbara A
Bought by
Mehalko Scott
Purchase Details
Closed on
Jan 1, 1975
Bought by
Snelling Barbara A
Create a Home Valuation Report for This Property
The Home Valuation Report is an in-depth analysis detailing your home's value as well as a comparison with similar homes in the area
Home Values in the Area
Average Home Value in this Area
Purchase History
| Date | Buyer | Sale Price | Title Company |
|---|---|---|---|
| Hungate Katharine F | $159,400 | -- | |
| Kopczewski Gregory A | $152,000 | -- | |
| Mehalko Scott | $119,500 | -- | |
| Snelling Barbara A | -- | -- |
Source: Public Records
Mortgage History
| Date | Status | Borrower | Loan Amount |
|---|---|---|---|
| Open | Hungate Katharine F | $127,480 | |
| Closed | Kopczewski Gregory A | $121,600 |
Source: Public Records
Tax History Compared to Growth
Tax History
| Year | Tax Paid | Tax Assessment Tax Assessment Total Assessment is a certain percentage of the fair market value that is determined by local assessors to be the total taxable value of land and additions on the property. | Land | Improvement |
|---|---|---|---|---|
| 2024 | $7,608 | $89,985 | $16,065 | $73,920 |
| 2023 | $6,798 | $62,730 | $12,220 | $50,510 |
| 2022 | $6,763 | $62,720 | $12,220 | $50,510 |
| 2021 | $6,626 | $62,720 | $12,220 | $50,510 |
| 2020 | $6,543 | $56,000 | $10,920 | $45,080 |
| 2019 | $6,180 | $160,000 | $31,200 | $128,800 |
| 2018 | $6,423 | $56,000 | $10,920 | $45,080 |
| 2017 | $7,043 | $59,440 | $10,680 | $48,760 |
| 2016 | $7,029 | $59,440 | $10,680 | $48,760 |
| 2015 | $6,170 | $59,440 | $10,680 | $48,760 |
| 2014 | $6,170 | $55,020 | $9,870 | $45,150 |
Source: Public Records
Map
Nearby Homes
- 2482 Princeton Rd
- 3609 E Scarborough Rd
- 3528 Meadowbrook Blvd
- 2423 Eaton Rd
- 3705 Meadowbrook Blvd
- 2619 Kingston Rd
- 2551 Ashurst Rd
- 3540 Silsby Rd
- 2653 Kingston Rd
- 3771 Meadowbrook Blvd
- 3485 Silsby Rd
- 3343 E Scarborough Rd
- 2272 S Taylor Rd
- 2448 Charney Rd
- 2235 Brockway Rd
- 3327 Bradford Rd
- 3323 E Fairfax Rd
- 3311 E Fairfax Rd
- 3333 Ormond Rd
- 2227 Cranston Rd
- 2472 Princeton Rd
- 2468 Princeton Rd
- 2488 Princeton Rd
- 2462 Princeton Rd
- 2494 Princeton Rd
- 2458 Princeton Rd
- 2498 Princeton Rd
- 2479 Kingston Rd
- 2475 Kingston Rd
- 2483 Kingston Rd
- 2469 Kingston Rd
- 2489 Kingston Rd
- 2463 Kingston Rd
- 2495 Kingston Rd
- 2452 Princeton Rd
- 2502 Princeton Rd
- 2459 Kingston Rd
- 2499 Kingston Rd
- 2448 Princeton Rd
- 2508 Princeton Rd