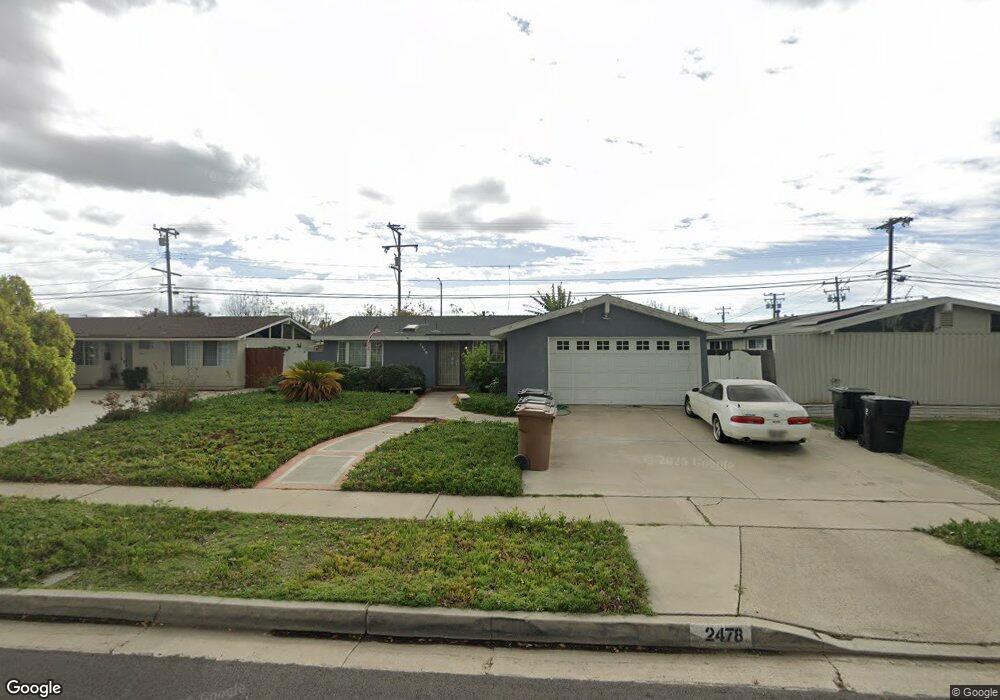
2478 Santa Clara Ave Fullerton, CA 92831
Estimated Value: $905,000 - $1,009,000
4
Beds
2
Baths
1,500
Sq Ft
$633/Sq Ft
Est. Value
About This Home
This home is located at 2478 Santa Clara Ave, Fullerton, CA 92831 and is currently estimated at $949,672, approximately $633 per square foot. 2478 Santa Clara Ave is a home located in Orange County with nearby schools including Commonwealth Elementary School, Ladera Vista Junior High School, and Troy High School.
Ownership History
Date
Name
Owned For
Owner Type
Purchase Details
Closed on
Mar 14, 2018
Sold by
Le Thang M and Tran Jennifer Thanh
Bought by
Le Thang M
Current Estimated Value
Home Financials for this Owner
Home Financials are based on the most recent Mortgage that was taken out on this home.
Original Mortgage
$180,000
Outstanding Balance
$129,793
Interest Rate
4.32%
Mortgage Type
New Conventional
Estimated Equity
$819,880
Purchase Details
Closed on
Apr 12, 2017
Sold by
Le Chung Thikim
Bought by
Le Thang M and Tran Jennifer Thanh
Purchase Details
Closed on
Nov 4, 2013
Sold by
Le Chung Kim Thi
Bought by
Le Chung Thikim and The Chung Thikim Le Living Trust
Purchase Details
Closed on
Feb 14, 1996
Sold by
Davenport Stanley W and Davenport Kathleen G
Bought by
Le Chung Kim Thi
Home Financials for this Owner
Home Financials are based on the most recent Mortgage that was taken out on this home.
Original Mortgage
$151,200
Interest Rate
7.41%
Create a Home Valuation Report for This Property
The Home Valuation Report is an in-depth analysis detailing your home's value as well as a comparison with similar homes in the area
Home Values in the Area
Average Home Value in this Area
Purchase History
| Date | Buyer | Sale Price | Title Company |
|---|---|---|---|
| Le Thang M | -- | Fidelity National Title | |
| Le Thang M | $300,000 | Wfg National Title Company | |
| Le Chung Thikim | -- | None Available | |
| Le Chung Kim Thi | $168,000 | Southland Title Company |
Source: Public Records
Mortgage History
| Date | Status | Borrower | Loan Amount |
|---|---|---|---|
| Open | Le Thang M | $180,000 | |
| Previous Owner | Le Chung Kim Thi | $151,200 |
Source: Public Records
Tax History Compared to Growth
Tax History
| Year | Tax Paid | Tax Assessment Tax Assessment Total Assessment is a certain percentage of the fair market value that is determined by local assessors to be the total taxable value of land and additions on the property. | Land | Improvement |
|---|---|---|---|---|
| 2025 | $6,386 | $580,292 | $511,558 | $68,734 |
| 2024 | $6,386 | $568,914 | $501,527 | $67,387 |
| 2023 | $6,231 | $557,759 | $491,693 | $66,066 |
| 2022 | $6,188 | $546,823 | $482,052 | $64,771 |
| 2021 | $6,080 | $536,101 | $472,600 | $63,501 |
| 2020 | $6,046 | $530,604 | $467,754 | $62,850 |
| 2019 | $5,887 | $520,200 | $458,582 | $61,618 |
| 2018 | $5,798 | $510,000 | $449,590 | $60,410 |
| 2017 | $2,884 | $240,468 | $169,851 | $70,617 |
| 2016 | $2,824 | $235,753 | $166,520 | $69,233 |
| 2015 | $2,747 | $232,212 | $164,018 | $68,194 |
| 2014 | $2,668 | $227,664 | $160,805 | $66,859 |
Source: Public Records
Map
Nearby Homes
- 2431 Santa Ysabel Ave
- 2334 E Santa fe Ave
- 2616 Balfour Ave
- 2220 E Chapman Ave Unit 11
- 619 W Chapman Ave
- 820 Cardinal St
- 317 W Santa fe Ave
- 315 W Santa fe Ave
- 712 Oriole Ave
- 1756 E Commonwealth Ave Unit 101
- 1909 E Wilshire Ave
- 201 S Melrose St
- 401 Stardust Dr
- 2301 Nutwood Ave
- 400 N Acacia Ave Unit B10
- 400 N Acacia Ave Unit C33
- 400 N Acacia Ave
- 400 N Acacia Ave Unit A13
- 400 N Acacia Ave Unit B24
- 400 N Acacia Ave Unit B12
- 2484 Santa Clara Ave
- 2474 Santa Clara Ave
- 2470 Santa Clara Ave
- 2488 Santa Clara Ave
- 2466 Santa Clara Ave
- 2462 Santa Clara Ave
- 2500 Santa Clara Ave
- 2458 Santa Clara Ave
- 2466 Fender Ave
- 2500 San Carlos Dr
- 2506 Santa Clara Ave
- 2502 San Carlos Dr
- 2454 Santa Clara Ave
- 2510 Santa Clara Ave
- 2504 San Carlos Dr
- 237 Aquila Ave
- 2501 E Santa fe Ave
- 2450 Santa Clara Ave
- 231 Aquila Ave
- 2506 San Carlos Dr