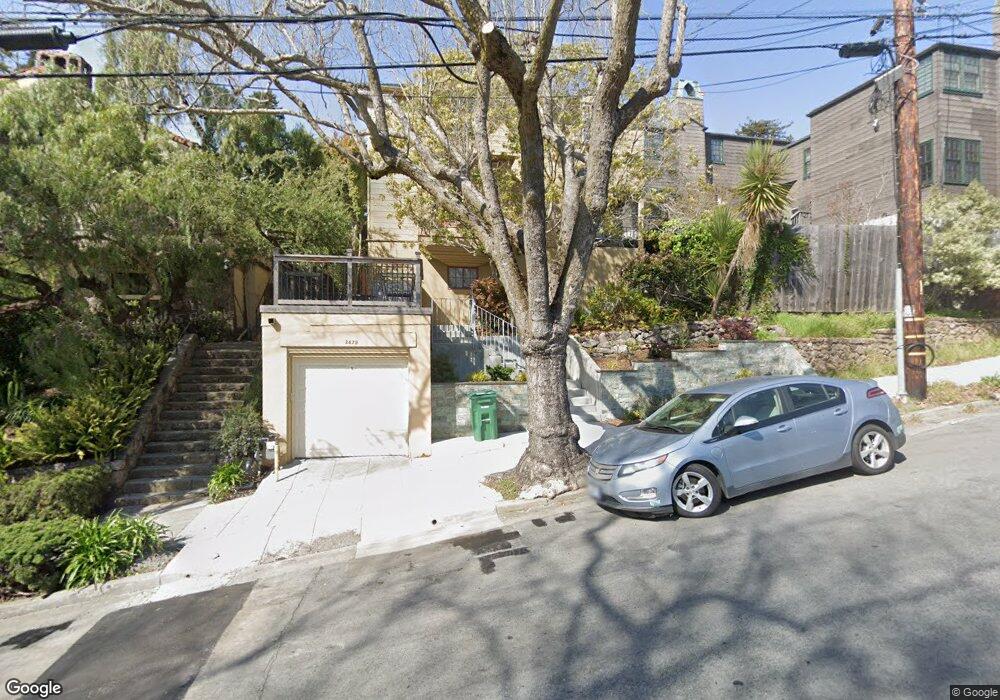
2479 Cedar St Berkeley, CA 94708
North Berkeley NeighborhoodEstimated Value: $1,405,000 - $1,686,000
3
Beds
2
Baths
1,736
Sq Ft
$885/Sq Ft
Est. Value
About This Home
This home is located at 2479 Cedar St, Berkeley, CA 94708 and is currently estimated at $1,535,883, approximately $884 per square foot. 2479 Cedar St is a home located in Alameda County with nearby schools including Berkeley Arts Magnet at Whittier School, Cragmont Elementary School, and Washington Elementary School.
Ownership History
Date
Name
Owned For
Owner Type
Purchase Details
Closed on
Oct 6, 2023
Sold by
2018 Charlyn Hook And Eric Boskin Family
Bought by
Eric D Boskin Trust and Boskin
Current Estimated Value
Purchase Details
Closed on
Oct 30, 2020
Sold by
Boskin Eric D and Hook Charlyn
Bought by
Boskin Eric and Hook Harlyn
Purchase Details
Closed on
Sep 20, 2011
Sold by
Boskin Eric D and Boskin Eric D
Bought by
Boskin Eric D
Home Financials for this Owner
Home Financials are based on the most recent Mortgage that was taken out on this home.
Original Mortgage
$437,000
Interest Rate
4.09%
Mortgage Type
New Conventional
Purchase Details
Closed on
Jan 12, 2010
Sold by
Coulter Edwin F and Edwin F Coulter 2007 Revocable
Bought by
Boskin Eric D
Home Financials for this Owner
Home Financials are based on the most recent Mortgage that was taken out on this home.
Original Mortgage
$447,000
Interest Rate
4.78%
Mortgage Type
New Conventional
Purchase Details
Closed on
Dec 27, 2007
Sold by
Coulter Edwin F
Bought by
Coulter Edwin F and Edwin F Coulter 2007 Revocable
Create a Home Valuation Report for This Property
The Home Valuation Report is an in-depth analysis detailing your home's value as well as a comparison with similar homes in the area
Home Values in the Area
Average Home Value in this Area
Purchase History
| Date | Buyer | Sale Price | Title Company |
|---|---|---|---|
| Eric D Boskin Trust | -- | None Listed On Document | |
| Boskin Eric | -- | None Available | |
| Boskin Eric D | -- | Old Republic Title Company | |
| Boskin Eric D | $660,000 | Chicago Title Company | |
| Coulter Edwin F | -- | None Available |
Source: Public Records
Mortgage History
| Date | Status | Borrower | Loan Amount |
|---|---|---|---|
| Previous Owner | Boskin Eric D | $437,000 | |
| Previous Owner | Boskin Eric D | $447,000 |
Source: Public Records
Tax History
| Year | Tax Paid | Tax Assessment Tax Assessment Total Assessment is a certain percentage of the fair market value that is determined by local assessors to be the total taxable value of land and additions on the property. | Land | Improvement |
|---|---|---|---|---|
| 2025 | $13,678 | $851,881 | $255,564 | $596,317 |
| 2024 | $13,678 | $835,183 | $250,555 | $584,628 |
| 2023 | $13,390 | $818,808 | $245,642 | $573,166 |
| 2022 | $13,135 | $802,757 | $240,827 | $561,930 |
| 2021 | $13,159 | $787,023 | $236,107 | $550,916 |
| 2020 | $12,405 | $778,957 | $233,687 | $545,270 |
| 2019 | $11,869 | $763,685 | $229,105 | $534,580 |
| 2018 | $11,662 | $748,717 | $224,615 | $524,102 |
| 2017 | $11,262 | $734,038 | $220,211 | $513,827 |
| 2016 | $10,872 | $719,650 | $215,895 | $503,755 |
| 2015 | $10,723 | $708,845 | $212,653 | $496,192 |
| 2014 | $10,638 | $694,966 | $208,490 | $486,476 |
Source: Public Records
Map
Nearby Homes
- 2421 Hilgard Ave
- 1622 Scenic Ave
- 2477 Virginia St
- 2600 Hilgard Ave
- 2451 Le Conte Ave
- 2340 Virginia St
- 1698 La Loma Ave Unit 1698
- 2501 Rose Walk
- 1515 Oxford St Unit 1D
- 2700 Le Conte Ave Unit 301
- 2700 Le Conte Ave Unit 402
- 1739 Spruce St
- 2201 Virginia St Unit 2
- 1682 Oxford St
- 1444 Walnut St
- 2686 Shasta Rd
- 2315 Eunice St
- 1408 Henry St
- 1610 Milvia St
- 2121 Eunice St
- 2471 Cedar St
- 1592 Euclid Ave
- 1580 Euclid Ave
- 2461 Cedar St
- 1574 Euclid Ave
- 2470 Cedar St
- 1597 Hawthorne Terrace
- 1566 Euclid Ave
- 1599 Euclid Ave
- 1595 Euclid Ave Unit A
- 1600 Euclid Ave
- 1591 Hawthorne Terrace
- 2504 Hill Ct
- 1568 Euclid Ave
- 1573 Hawthorne Terrace
- 1573 Hawthorne Terrace
- 2454 Cedar St
- 1560 Euclid Ave
- 2501 Hill Ct
- 2505 Cedar St
Your Personal Tour Guide
Ask me questions while you tour the home.