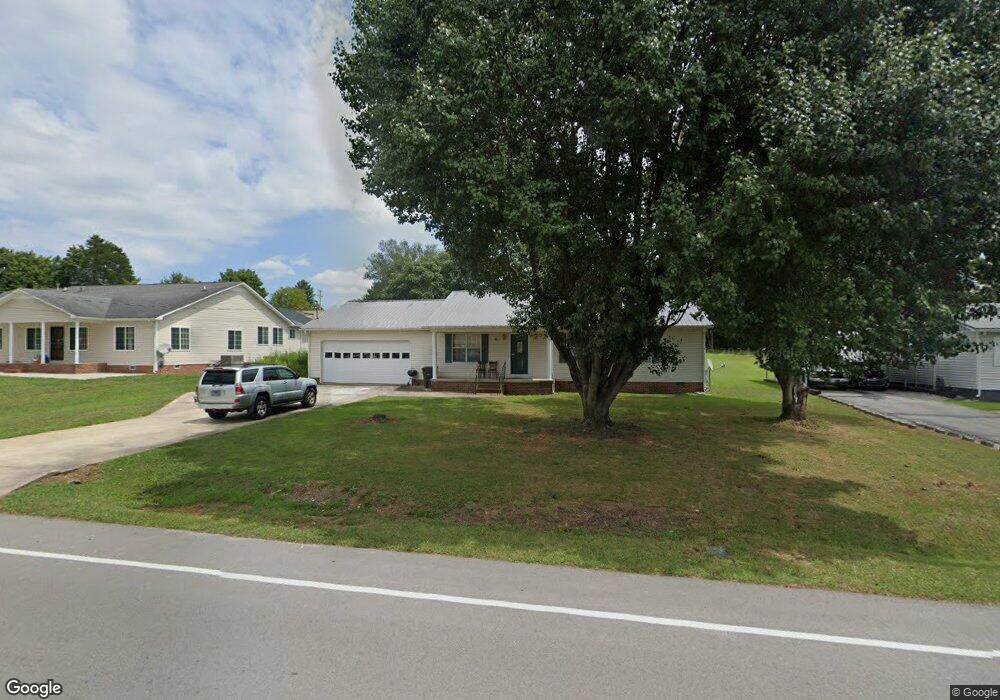
248 Allen Dr Sparta, TN 38583
Estimated Value: $186,000 - $301,000
--
Bed
2
Baths
1,553
Sq Ft
$154/Sq Ft
Est. Value
About This Home
This home is located at 248 Allen Dr, Sparta, TN 38583 and is currently estimated at $238,929, approximately $153 per square foot. 248 Allen Dr is a home located in White County with nearby schools including Findlay Elementary School, White County Middle School, and White County High School.
Ownership History
Date
Name
Owned For
Owner Type
Purchase Details
Closed on
Apr 6, 2018
Sold by
Yan Kai Zheng Zheng and Yan Ying Zhao
Bought by
Zhao Yixing
Current Estimated Value
Purchase Details
Closed on
Jul 22, 1999
Sold by
Howell Fred E
Bought by
Kai Zheng Z and Kai Zhoa Y
Home Financials for this Owner
Home Financials are based on the most recent Mortgage that was taken out on this home.
Original Mortgage
$48,000
Interest Rate
7.66%
Purchase Details
Closed on
Jun 1, 1994
Bought by
Howell Fred E and Howell Hallie R
Purchase Details
Closed on
Jan 12, 1994
Bought by
Davis Ray and Davis Faye
Purchase Details
Closed on
Dec 27, 1993
Bought by
Davis Ray and Davis Faye
Purchase Details
Closed on
Apr 25, 1990
Bought by
Roberts Virginia H
Purchase Details
Closed on
Feb 22, 1989
Bought by
Simmons Don and Simmons Dorothy
Purchase Details
Closed on
Nov 26, 1986
Bought by
Payne Robert
Purchase Details
Closed on
Jan 2, 1900
Create a Home Valuation Report for This Property
The Home Valuation Report is an in-depth analysis detailing your home's value as well as a comparison with similar homes in the area
Home Values in the Area
Average Home Value in this Area
Purchase History
| Date | Buyer | Sale Price | Title Company |
|---|---|---|---|
| Zhao Yixing | $70,000 | None Available | |
| Kai Zheng Z | $81,000 | -- | |
| Howell Fred E | $73,000 | -- | |
| Davis Ray | -- | -- | |
| Davis Ray | $5,000 | -- | |
| Roberts Virginia H | -- | -- | |
| Simmons Don | -- | -- | |
| Payne Robert | -- | -- | |
| -- | -- | -- |
Source: Public Records
Mortgage History
| Date | Status | Borrower | Loan Amount |
|---|---|---|---|
| Previous Owner | Not Available | $48,000 |
Source: Public Records
Tax History Compared to Growth
Tax History
| Year | Tax Paid | Tax Assessment Tax Assessment Total Assessment is a certain percentage of the fair market value that is determined by local assessors to be the total taxable value of land and additions on the property. | Land | Improvement |
|---|---|---|---|---|
| 2025 | -- | $59,325 | $0 | $0 |
| 2024 | -- | $33,800 | $3,750 | $30,050 |
| 2023 | $954 | $33,800 | $3,750 | $30,050 |
| 2022 | $954 | $32,150 | $3,750 | $28,400 |
| 2021 | $954 | $32,150 | $3,750 | $28,400 |
| 2020 | $954 | $32,150 | $3,750 | $28,400 |
| 2019 | $815 | $26,275 | $3,000 | $23,275 |
| 2018 | $815 | $26,275 | $3,000 | $23,275 |
| 2017 | $815 | $26,275 | $3,000 | $23,275 |
| 2016 | $815 | $26,275 | $3,000 | $23,275 |
| 2015 | $762 | $26,275 | $3,000 | $23,275 |
| 2014 | -- | $26,275 | $3,000 | $23,275 |
| 2013 | -- | $26,350 | $3,000 | $23,350 |
Source: Public Records
Map
Nearby Homes