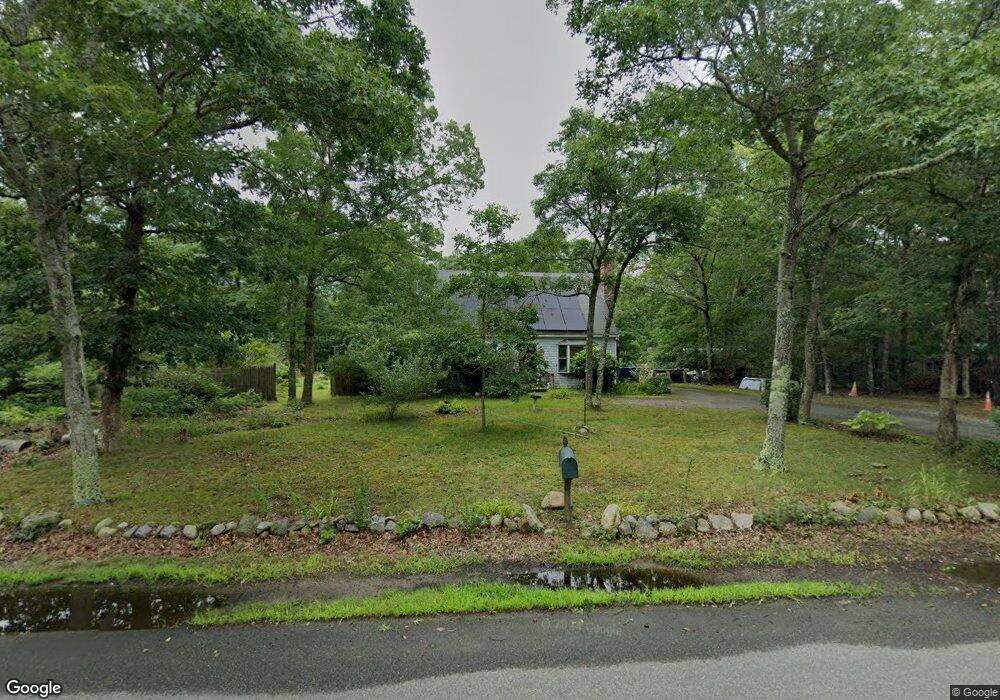
248 Ashumet Rd East Falmouth, MA 02536
Hatchville NeighborhoodEstimated Value: $583,106 - $627,000
4
Beds
2
Baths
1,152
Sq Ft
$533/Sq Ft
Est. Value
About This Home
This home is located at 248 Ashumet Rd, East Falmouth, MA 02536 and is currently estimated at $614,027, approximately $533 per square foot. 248 Ashumet Rd is a home located in Barnstable County with nearby schools including North Falmouth Elementary School, Morse Pond School, and Lawrence School.
Ownership History
Date
Name
Owned For
Owner Type
Purchase Details
Closed on
Jan 18, 2007
Sold by
Kanaley Daniel J and Kanaley Kathleen A
Bought by
Boesse Rebecca and Boesse Robert
Current Estimated Value
Home Financials for this Owner
Home Financials are based on the most recent Mortgage that was taken out on this home.
Original Mortgage
$284,050
Outstanding Balance
$169,085
Interest Rate
6.14%
Mortgage Type
Purchase Money Mortgage
Estimated Equity
$444,942
Create a Home Valuation Report for This Property
The Home Valuation Report is an in-depth analysis detailing your home's value as well as a comparison with similar homes in the area
Home Values in the Area
Average Home Value in this Area
Purchase History
| Date | Buyer | Sale Price | Title Company |
|---|---|---|---|
| Boesse Rebecca | $299,000 | -- |
Source: Public Records
Mortgage History
| Date | Status | Borrower | Loan Amount |
|---|---|---|---|
| Open | Boesse Rebecca | $284,050 |
Source: Public Records
Tax History Compared to Growth
Tax History
| Year | Tax Paid | Tax Assessment Tax Assessment Total Assessment is a certain percentage of the fair market value that is determined by local assessors to be the total taxable value of land and additions on the property. | Land | Improvement |
|---|---|---|---|---|
| 2025 | $2,654 | $452,100 | $176,300 | $275,800 |
| 2024 | $2,618 | $416,900 | $167,000 | $249,900 |
| 2023 | $2,637 | $381,100 | $167,000 | $214,100 |
| 2022 | $2,375 | $295,000 | $125,900 | $169,100 |
| 2021 | $2,290 | $269,400 | $120,400 | $149,000 |
| 2020 | $2,221 | $258,500 | $109,500 | $149,000 |
| 2019 | $2,069 | $241,700 | $109,500 | $132,200 |
| 2018 | $2,030 | $236,000 | $109,500 | $126,500 |
| 2017 | $1,981 | $232,200 | $109,500 | $122,700 |
| 2016 | $1,941 | $231,900 | $109,500 | $122,400 |
| 2015 | $1,899 | $231,900 | $109,500 | $122,400 |
| 2014 | $1,932 | $237,000 | $115,300 | $121,700 |
Source: Public Records
Map
Nearby Homes