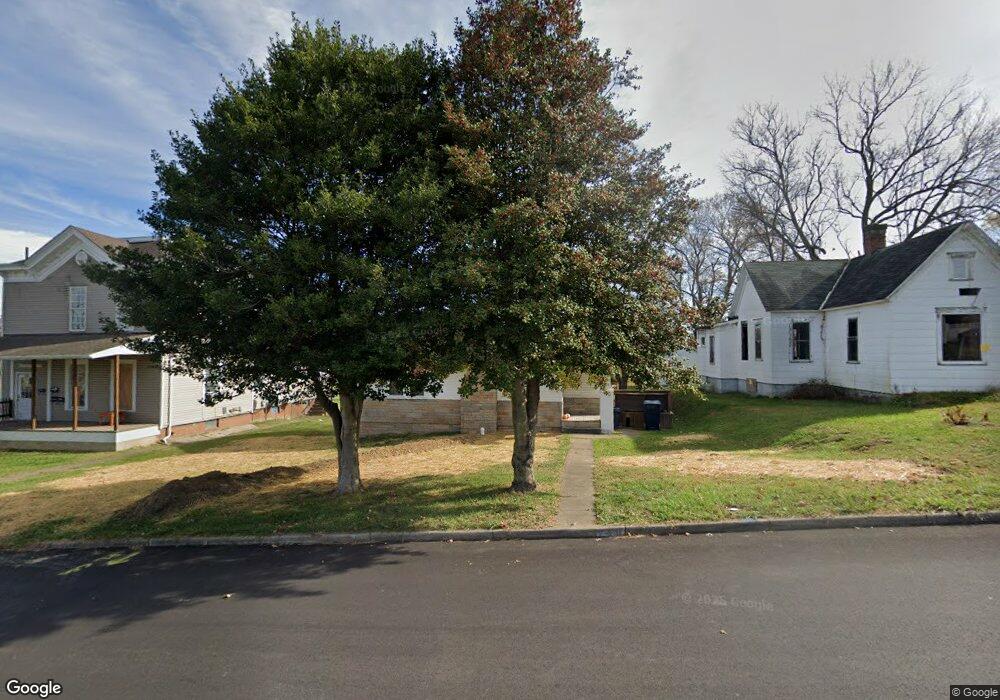
248 N High St Jackson, OH 45640
Estimated Value: $83,000 - $108,000
2
Beds
1
Bath
750
Sq Ft
$131/Sq Ft
Est. Value
About This Home
This home is located at 248 N High St, Jackson, OH 45640 and is currently estimated at $98,578, approximately $131 per square foot. 248 N High St is a home located in Jackson County with nearby schools including Jackson High School and Christian Life Academy.
Ownership History
Date
Name
Owned For
Owner Type
Purchase Details
Closed on
Jul 5, 2012
Sold by
Orton Caleb and Orton Alicia
Bought by
Collins Marcus L and Collins Melissa J
Current Estimated Value
Home Financials for this Owner
Home Financials are based on the most recent Mortgage that was taken out on this home.
Original Mortgage
$43,200
Interest Rate
3.77%
Mortgage Type
New Conventional
Purchase Details
Closed on
Nov 9, 2010
Sold by
Collins Marcus L and Collins Melissa A
Bought by
Orton Caleb and Orton Alicia
Home Financials for this Owner
Home Financials are based on the most recent Mortgage that was taken out on this home.
Original Mortgage
$45,600
Interest Rate
4.31%
Mortgage Type
Purchase Money Mortgage
Purchase Details
Closed on
Jul 17, 2009
Sold by
Rhea Erica Wallace and Wallace Erica A
Bought by
Collins Marcus L and Collins Melissa J
Purchase Details
Closed on
Aug 21, 2003
Sold by
Barnes Tracy L
Bought by
Wallace Erica A
Purchase Details
Closed on
Jul 25, 1995
Sold by
Brohard Scott E
Bought by
Barnes Tracy L
Create a Home Valuation Report for This Property
The Home Valuation Report is an in-depth analysis detailing your home's value as well as a comparison with similar homes in the area
Home Values in the Area
Average Home Value in this Area
Purchase History
| Date | Buyer | Sale Price | Title Company |
|---|---|---|---|
| Collins Marcus L | $42,512 | None Available | |
| Collins Marcus L | $44,750 | None Available | |
| Orton Caleb | $57,000 | Arrow Title Agency Llc | |
| Collins Marcus L | $56,000 | None Available | |
| Wallace Erica A | $55,500 | -- | |
| Barnes Tracy L | $33,000 | -- |
Source: Public Records
Mortgage History
| Date | Status | Borrower | Loan Amount |
|---|---|---|---|
| Closed | Collins Marcus L | $43,200 | |
| Closed | Orton Caleb | $45,600 |
Source: Public Records
Tax History
| Year | Tax Paid | Tax Assessment Tax Assessment Total Assessment is a certain percentage of the fair market value that is determined by local assessors to be the total taxable value of land and additions on the property. | Land | Improvement |
|---|---|---|---|---|
| 2025 | $845 | $22,990 | $6,270 | $16,720 |
| 2024 | $853 | $22,990 | $6,270 | $16,720 |
| 2023 | $868 | $22,990 | $6,270 | $16,720 |
| 2022 | $945 | $18,520 | $5,900 | $12,620 |
| 2021 | $754 | $18,520 | $5,900 | $12,620 |
| 2020 | $374 | $18,520 | $5,900 | $12,620 |
| 2019 | $676 | $16,390 | $5,220 | $11,170 |
| 2018 | $652 | $16,390 | $5,220 | $11,170 |
| 2017 | $625 | $16,390 | $5,220 | $11,170 |
| 2016 | $667 | $17,270 | $5,150 | $12,120 |
| 2015 | $671 | $17,270 | $5,150 | $12,120 |
| 2013 | $647 | $16,690 | $5,150 | $11,540 |
| 2012 | $638 | $16,690 | $5,150 | $11,540 |
Source: Public Records
Map
Nearby Homes
Your Personal Tour Guide
Ask me questions while you tour the home.