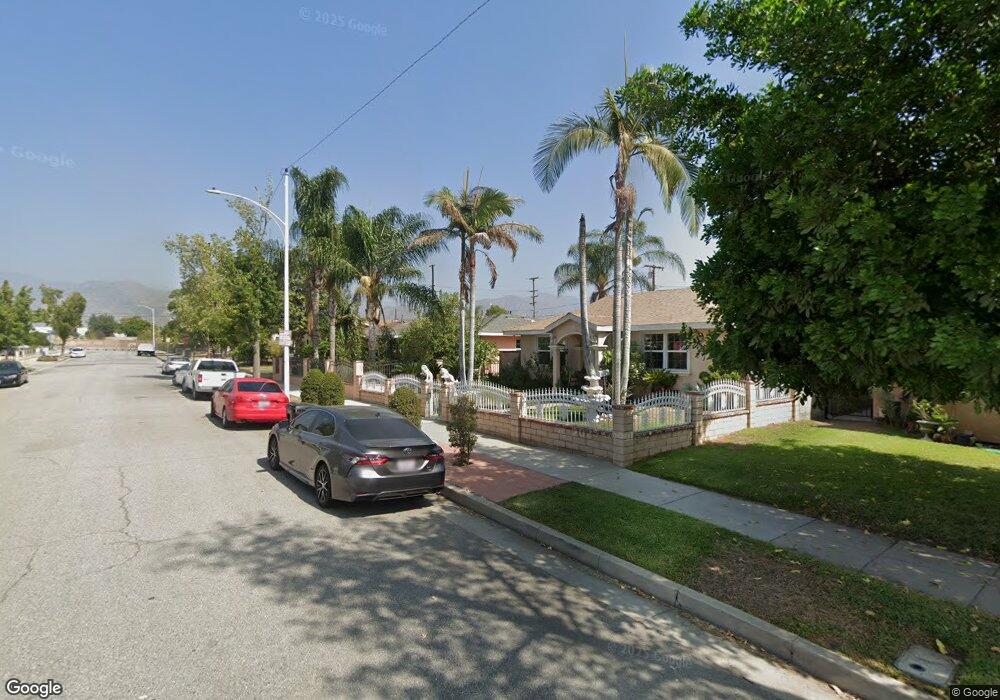
248 N Virginia Ave Azusa, CA 91702
South Azusa NeighborhoodEstimated Value: $680,000 - $807,000
4
Beds
3
Baths
1,333
Sq Ft
$564/Sq Ft
Est. Value
About This Home
This home is located at 248 N Virginia Ave, Azusa, CA 91702 and is currently estimated at $751,505, approximately $563 per square foot. 248 N Virginia Ave is a home located in Los Angeles County with nearby schools including Gladstone High School, Christbridge Academy, and St. Frances of Rome School.
Ownership History
Date
Name
Owned For
Owner Type
Purchase Details
Closed on
Nov 14, 2006
Sold by
Castillo Rene I
Bought by
Castillo Lupe
Current Estimated Value
Home Financials for this Owner
Home Financials are based on the most recent Mortgage that was taken out on this home.
Original Mortgage
$388,000
Outstanding Balance
$230,245
Interest Rate
6.36%
Mortgage Type
New Conventional
Estimated Equity
$521,260
Purchase Details
Closed on
Dec 5, 2003
Sold by
Shofstall Earle W
Bought by
Castillo Rene I and Castillo Lupe
Home Financials for this Owner
Home Financials are based on the most recent Mortgage that was taken out on this home.
Original Mortgage
$280,250
Interest Rate
7.25%
Mortgage Type
Purchase Money Mortgage
Purchase Details
Closed on
Jan 14, 1999
Sold by
Arias Leonard Naranjo
Bought by
Shofstall Ii Earle W
Purchase Details
Closed on
Nov 5, 1996
Sold by
Fletcher Bobbie
Bought by
Arias Leonard Naranjo and Arias Rosalie Garcia
Create a Home Valuation Report for This Property
The Home Valuation Report is an in-depth analysis detailing your home's value as well as a comparison with similar homes in the area
Home Values in the Area
Average Home Value in this Area
Purchase History
| Date | Buyer | Sale Price | Title Company |
|---|---|---|---|
| Castillo Lupe | -- | New Century Title Company | |
| Castillo Rene I | $295,000 | Security Union | |
| Shofstall Ii Earle W | -- | -- | |
| Arias Leonard Naranjo | $84,500 | -- |
Source: Public Records
Mortgage History
| Date | Status | Borrower | Loan Amount |
|---|---|---|---|
| Open | Castillo Lupe | $388,000 | |
| Previous Owner | Castillo Rene I | $280,250 |
Source: Public Records
Tax History Compared to Growth
Tax History
| Year | Tax Paid | Tax Assessment Tax Assessment Total Assessment is a certain percentage of the fair market value that is determined by local assessors to be the total taxable value of land and additions on the property. | Land | Improvement |
|---|---|---|---|---|
| 2025 | $7,921 | $644,044 | $466,527 | $177,517 |
| 2024 | $7,921 | $631,417 | $457,380 | $174,037 |
| 2023 | $7,708 | $619,037 | $448,412 | $170,625 |
| 2022 | $7,613 | $606,900 | $439,620 | $167,280 |
| 2021 | $4,910 | $387,472 | $255,602 | $131,870 |
| 2020 | $4,817 | $383,500 | $252,982 | $130,518 |
| 2019 | $4,747 | $375,981 | $248,022 | $127,959 |
| 2018 | $4,516 | $368,609 | $243,159 | $125,450 |
| 2016 | $4,323 | $354,298 | $233,718 | $120,580 |
| 2015 | $4,251 | $348,977 | $230,208 | $118,769 |
| 2014 | $3,881 | $334,000 | $221,000 | $113,000 |
Source: Public Records
Map
Nearby Homes
- 417 N Vernon Ave
- 175 N San Gabriel Ave
- 403 N San Gabriel Ave
- 932 Momax St
- 227 N Azusa Ave
- 11 N San Gabriel Canyon Ave
- 890 E Gladstone St
- 415 S Grandin Ave
- 207 N Pasadena Ave
- 5527 N Gareloch Ave
- 936 N Enid Ave
- 17049 E Orkney St
- 248 N Rodecker Dr
- 628 N Pasadena Ave
- 900 W Sierra Madre Ave Unit 44
- 433 E Mason St
- 830 N Dalton Ave Unit 210
- 904 N Dalton Ave
- 307 W 11th St
- 17139 E Newburgh St
- 242 N Virginia Ave
- 252 N Virginia Ave
- 238 N Virginia Ave
- 258 N Virginia Ave
- 232 N Virginia Ave
- 239 N Barbara Ave
- 235 N Barbara Ave
- 243 N Barbara Ave
- 231 N Barbara Ave
- 239 N Virginia Ave
- 226 N Virginia Ave
- 243 N Virginia Ave
- 235 N Virginia Ave
- 304 N Virginia Ave
- 229 N Barbara Ave
- 247 N Virginia Ave
- 231 N Virginia Ave
- 227 N Virginia Ave
- 227 N Barbara Ave
- 223 N Virginia Ave