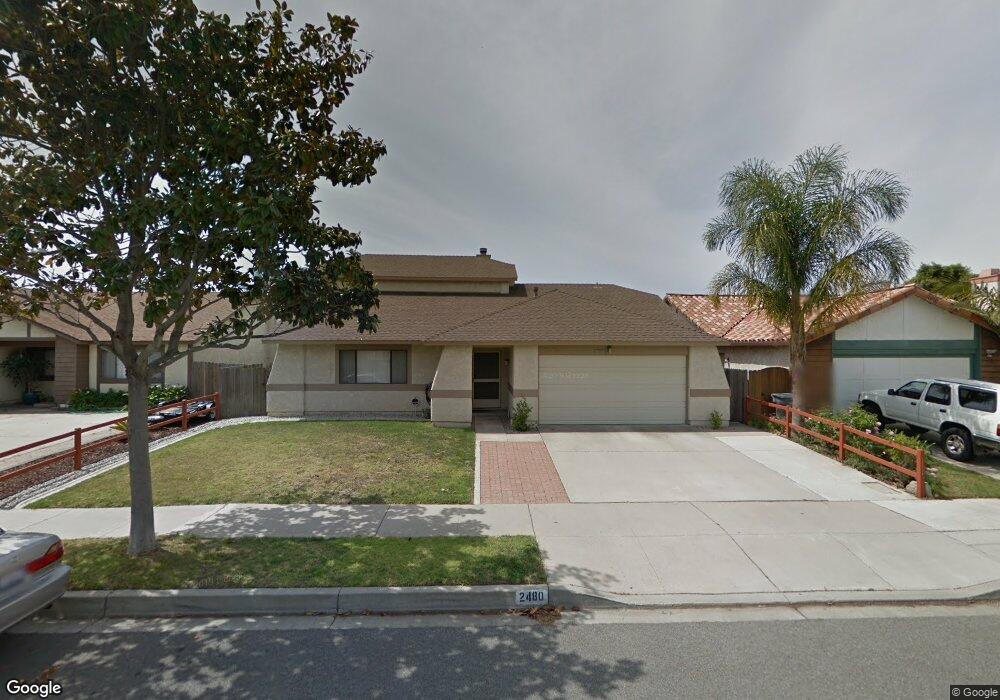
2480 Oarfish Ln Oxnard, CA 93035
Sea Air NeighborhoodEstimated Value: $831,000 - $899,000
4
Beds
3
Baths
1,913
Sq Ft
$445/Sq Ft
Est. Value
About This Home
This home is located at 2480 Oarfish Ln, Oxnard, CA 93035 and is currently estimated at $851,006, approximately $444 per square foot. 2480 Oarfish Ln is a home located in Ventura County with nearby schools including Juan Lagunas Soria Elementary School and Oxnard High School.
Ownership History
Date
Name
Owned For
Owner Type
Purchase Details
Closed on
Dec 6, 2016
Sold by
Flagg Kendall B
Bought by
Flagg Kendall B
Current Estimated Value
Purchase Details
Closed on
Mar 3, 2016
Sold by
Flagg Carol Jean
Bought by
Flagg Kendall B
Purchase Details
Closed on
Jun 5, 2000
Sold by
Flagg Kendall B and Flagg Carol J
Bought by
Flagg Carol Jean
Purchase Details
Closed on
Apr 6, 2000
Sold by
Flagg Kendall B and Flagg Carol J
Bought by
Flagg Carol Jean
Purchase Details
Closed on
Mar 16, 2000
Sold by
Flagg Kendall B and Flagg Carol J
Bought by
Flagg Kendall B and Flagg Carol Jean
Purchase Details
Closed on
Aug 28, 1998
Sold by
Flagg Kendall B and Flagg Carol J
Bought by
Flagg Kendall B and Flagg Carol J
Purchase Details
Closed on
May 2, 1997
Sold by
Flagg Kendall B and Flagg Carol J
Bought by
Flagg Kendall B and Flagg Carol J
Purchase Details
Closed on
Nov 14, 1995
Sold by
Park Byung Kyu and Park Ock Hee
Bought by
Flagg Kendall B and Hastings Carol J
Home Financials for this Owner
Home Financials are based on the most recent Mortgage that was taken out on this home.
Original Mortgage
$142,800
Interest Rate
7.48%
Create a Home Valuation Report for This Property
The Home Valuation Report is an in-depth analysis detailing your home's value as well as a comparison with similar homes in the area
Home Values in the Area
Average Home Value in this Area
Purchase History
| Date | Buyer | Sale Price | Title Company |
|---|---|---|---|
| Flagg Kendall B | -- | None Available | |
| Flagg Kendall B | -- | None Available | |
| Flagg Carol Jean | -- | -- | |
| Flagg Kendall B | -- | -- | |
| Flagg Carol Jean | -- | -- | |
| Flagg Kendall B | -- | -- | |
| Flagg Kendall B | -- | -- | |
| Flagg Kendall B | -- | -- | |
| Flagg Kendall B | $178,500 | Chicago Title Co |
Source: Public Records
Mortgage History
| Date | Status | Borrower | Loan Amount |
|---|---|---|---|
| Previous Owner | Flagg Kendall B | $142,800 |
Source: Public Records
Tax History
| Year | Tax Paid | Tax Assessment Tax Assessment Total Assessment is a certain percentage of the fair market value that is determined by local assessors to be the total taxable value of land and additions on the property. | Land | Improvement |
|---|---|---|---|---|
| 2025 | $3,653 | $306,077 | $118,593 | $187,484 |
| 2024 | $3,653 | $300,076 | $116,268 | $183,808 |
| 2023 | $3,519 | $294,193 | $113,989 | $180,204 |
| 2022 | $3,412 | $288,425 | $111,754 | $176,671 |
| 2021 | $3,383 | $282,770 | $109,563 | $173,207 |
| 2020 | $3,445 | $279,873 | $108,441 | $171,432 |
| 2019 | $3,346 | $274,386 | $106,315 | $168,071 |
| 2018 | $3,298 | $269,007 | $104,231 | $164,776 |
| 2017 | $3,130 | $263,734 | $102,188 | $161,546 |
| 2016 | $3,019 | $258,564 | $100,185 | $158,379 |
| 2015 | $3,050 | $254,681 | $98,681 | $156,000 |
| 2014 | $3,015 | $249,695 | $96,749 | $152,946 |
Source: Public Records
Map
Nearby Homes
- 740 Freeport Ln
- 2923 Kelp Ln Unit 11
- 600 Freeport Ln
- 2919 Naples Dr
- 676 Snipe Walk
- 2900 Windward Way
- 1170 Windward Way
- 2213 Miramar Walk
- 2324 Miramar Walk
- 1077 Offshore St
- 1501 Pisco Ln
- 1309 Nautical Way
- 3554 Dunkirk Dr
- 1720 Elsinore Cir
- 1231 Lost Point Ln
- 1174 Oyster Place Unit 15
- 3001 Isle Way Unit B
- 807 Kingfisher Way
- 3746 Dunkirk Dr
- 2783 Bolker Dr
- 2470 Oarfish Ln
- 2500 Oarfish Ln
- 2511 Taffrail Ln
- 2501 Taffrail Ln
- 2521 Taffrail Ln
- 2460 Oarfish Ln
- 2510 Oarfish Ln
- 830 Oarfish Ct
- 2461 Taffrail Ln
- 2525 Taffrail Ln
- 2450 Oarfish Ln
- 2461 Oarfish Ln
- 2520 Oarfish Ln
- 831 Oarfish Ct
- 2451 Taffrail Ln
- 820 Oarfish Ct
- 2531 Taffrail Ln
- 2440 Oarfish Ln
- 911 Raft Ln
- 2600 Oarfish Ln
Your Personal Tour Guide
Ask me questions while you tour the home.