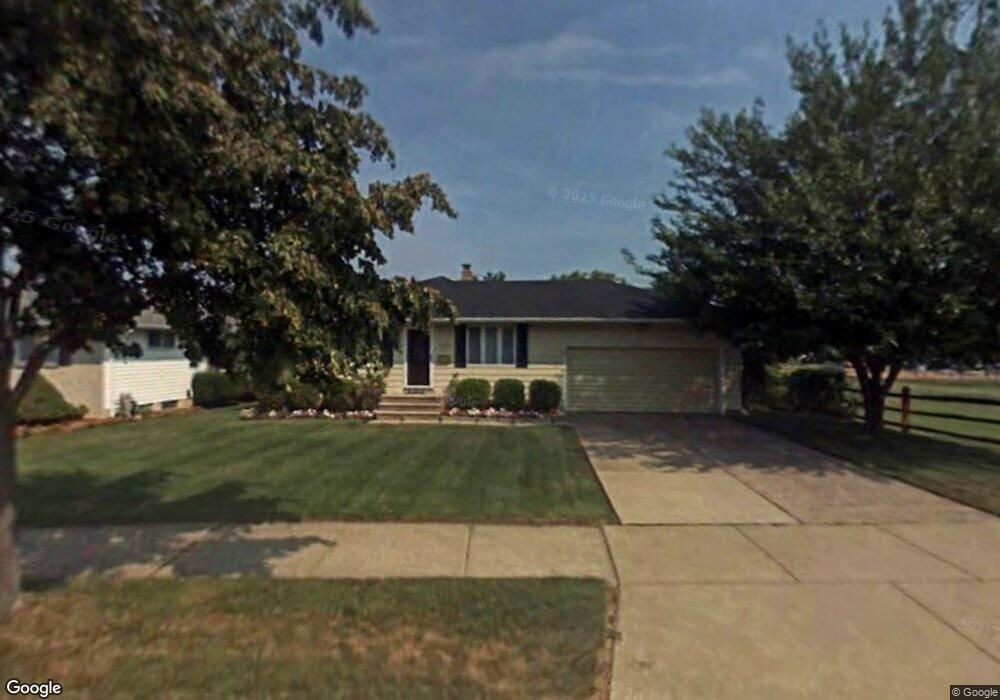
24801 Russell Ave Euclid, OH 44123
Estimated Value: $149,835 - $193,000
3
Beds
1
Bath
1,204
Sq Ft
$143/Sq Ft
Est. Value
About This Home
This home is located at 24801 Russell Ave, Euclid, OH 44123 and is currently estimated at $172,709, approximately $143 per square foot. 24801 Russell Ave is a home located in Cuyahoga County with nearby schools including Bluestone Elementary School, Euclid High School, and Pinnacle Academy.
Ownership History
Date
Name
Owned For
Owner Type
Purchase Details
Closed on
Jun 12, 2020
Sold by
Burrell Alex and Burrell Antoinette M
Bought by
Kermavner William A and Kermavner Marianne T
Current Estimated Value
Purchase Details
Closed on
Jun 6, 2002
Sold by
Persic Edward and Persic Milena
Bought by
Burrell Alex and Burrell Antoinette M
Home Financials for this Owner
Home Financials are based on the most recent Mortgage that was taken out on this home.
Original Mortgage
$128,976
Outstanding Balance
$54,765
Interest Rate
6.87%
Mortgage Type
FHA
Estimated Equity
$117,944
Purchase Details
Closed on
Sep 7, 1989
Sold by
Davis William Edward
Bought by
Persic Edward
Purchase Details
Closed on
Feb 6, 1980
Sold by
Davis Wm E and Davis Barbara M
Bought by
Davis William Edward
Purchase Details
Closed on
Jan 1, 1975
Bought by
Davis Wm E and Davis Barbara M
Create a Home Valuation Report for This Property
The Home Valuation Report is an in-depth analysis detailing your home's value as well as a comparison with similar homes in the area
Home Values in the Area
Average Home Value in this Area
Purchase History
| Date | Buyer | Sale Price | Title Company |
|---|---|---|---|
| Kermavner William A | $123,000 | Suntrust Title Agency | |
| Burrell Alex | $131,000 | City Title Company Agency In | |
| Persic Edward | $82,000 | -- | |
| Davis William Edward | -- | -- | |
| Davis Wm E | -- | -- |
Source: Public Records
Mortgage History
| Date | Status | Borrower | Loan Amount |
|---|---|---|---|
| Open | Burrell Alex | $128,976 |
Source: Public Records
Tax History Compared to Growth
Tax History
| Year | Tax Paid | Tax Assessment Tax Assessment Total Assessment is a certain percentage of the fair market value that is determined by local assessors to be the total taxable value of land and additions on the property. | Land | Improvement |
|---|---|---|---|---|
| 2024 | $4,005 | $57,575 | $9,555 | $48,020 |
| 2023 | $3,753 | $43,050 | $7,210 | $35,840 |
| 2022 | $3,668 | $43,050 | $7,210 | $35,840 |
| 2021 | $4,086 | $43,050 | $7,210 | $35,840 |
| 2020 | $3,202 | $31,010 | $6,230 | $24,780 |
| 2019 | $2,880 | $88,600 | $17,800 | $70,800 |
| 2018 | $2,908 | $31,010 | $6,230 | $24,780 |
| 2017 | $3,102 | $27,650 | $5,320 | $22,330 |
| 2016 | $3,109 | $27,650 | $5,320 | $22,330 |
| 2015 | $2,829 | $27,650 | $5,320 | $22,330 |
| 2014 | $2,829 | $27,650 | $5,320 | $22,330 |
Source: Public Records
Map
Nearby Homes
- 24330 Glenforest Rd
- 820 E 250th St
- 833 E 250th St
- 860 E 245th St
- 23901 Colbourne Rd
- 23880 Hartland Dr
- 24451 Devoe Ave
- 23896 Devoe Ave
- 861 E 256th St
- 825 E 256th St
- 720 E 254th St
- 754 E 256th St
- 795 E 260th St
- 25390 Briardale Ave
- 23198 Gay St
- 26268 Leslie Ave
- 25700 Briardale Ave
- 22751 Fox Ave
- 490 Kenwood Dr Unit B
- 23337 Williams Ave
- 24751 Russell Ave
- 24731 Wayne Ct
- 24721 Wayne Ct
- 24800 Russell Ave
- 24810 Russell Ave
- 24750 Russell Ave
- 24820 Russell Ave
- 24701 Wayne Ct
- 24700 Russell Ave
- 24830 Russell Ave
- 24601 Russell Ave
- 24650 Russell Ave
- 24671 Wayne Ct
- 24840 Russell Ave
- 24691 Wayne Ct
- 24600 Alberton Rd
- 24630 Alberton Rd
- 24570 Alberton Rd
- 24600 Russell Ave
- 24551 Russell Ave