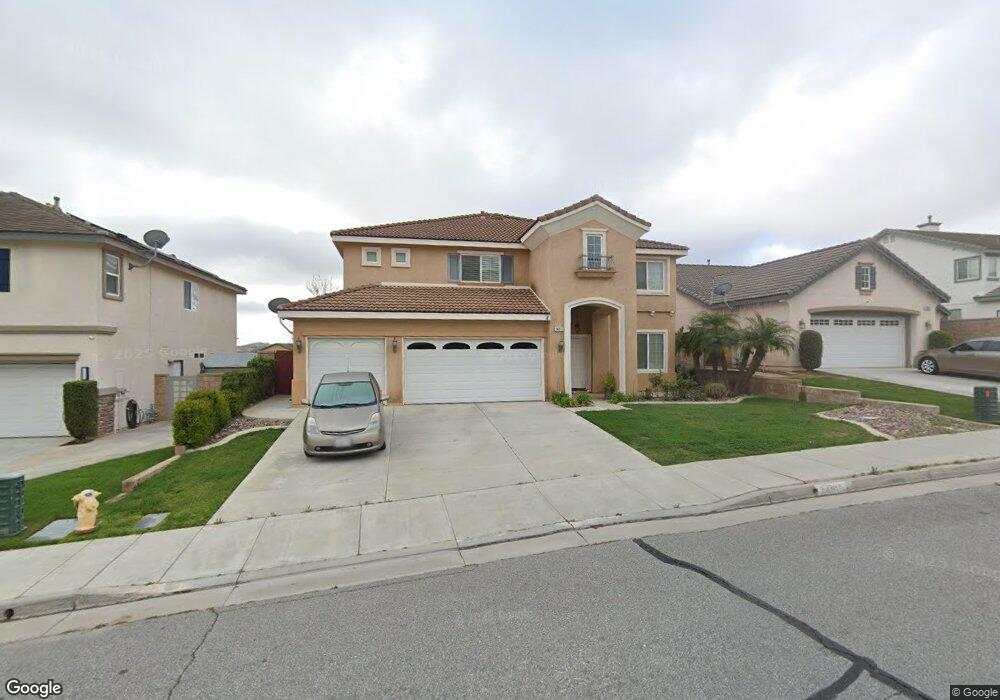
24817 Springbrook Way Menifee, CA 92584
Sun City NeighborhoodEstimated Value: $658,715 - $710,000
5
Beds
3
Baths
3,142
Sq Ft
$218/Sq Ft
Est. Value
About This Home
This home is located at 24817 Springbrook Way, Menifee, CA 92584 and is currently estimated at $685,179, approximately $218 per square foot. 24817 Springbrook Way is a home located in Riverside County with nearby schools including Ridgemoor Elementary School, Menifee Valley Middle School, and Pinacate Middle School.
Ownership History
Date
Name
Owned For
Owner Type
Purchase Details
Closed on
Apr 6, 2010
Sold by
Berry Gregory A and Berry Laura K
Bought by
Abantao John A and Abantao Elizabeth A
Current Estimated Value
Home Financials for this Owner
Home Financials are based on the most recent Mortgage that was taken out on this home.
Original Mortgage
$219,622
Interest Rate
5.05%
Mortgage Type
VA
Purchase Details
Closed on
Sep 14, 2004
Sold by
Wl Homes Llc
Bought by
Berry Gregory A and Berry Laura K
Home Financials for this Owner
Home Financials are based on the most recent Mortgage that was taken out on this home.
Original Mortgage
$332,264
Interest Rate
1%
Mortgage Type
New Conventional
Create a Home Valuation Report for This Property
The Home Valuation Report is an in-depth analysis detailing your home's value as well as a comparison with similar homes in the area
Home Values in the Area
Average Home Value in this Area
Purchase History
| Date | Buyer | Sale Price | Title Company |
|---|---|---|---|
| Abantao John A | $234,545 | Chicago Title Company | |
| Berry Gregory A | $415,500 | Chicago |
Source: Public Records
Mortgage History
| Date | Status | Borrower | Loan Amount |
|---|---|---|---|
| Previous Owner | Abantao John A | $219,622 | |
| Previous Owner | Berry Gregory A | $332,264 |
Source: Public Records
Tax History
| Year | Tax Paid | Tax Assessment Tax Assessment Total Assessment is a certain percentage of the fair market value that is determined by local assessors to be the total taxable value of land and additions on the property. | Land | Improvement |
|---|---|---|---|---|
| 2025 | $5,361 | $302,736 | $77,437 | $225,299 |
| 2023 | $5,361 | $290,982 | $74,431 | $216,551 |
| 2022 | $5,317 | $285,277 | $72,972 | $212,305 |
| 2021 | $5,302 | $279,685 | $71,542 | $208,143 |
| 2020 | $5,239 | $276,818 | $70,809 | $206,009 |
| 2019 | $5,159 | $271,391 | $69,421 | $201,970 |
| 2018 | $5,007 | $266,070 | $68,061 | $198,009 |
| 2017 | $4,942 | $260,854 | $66,727 | $194,127 |
| 2016 | $4,837 | $255,740 | $65,419 | $190,321 |
| 2015 | $4,782 | $251,901 | $64,438 | $187,463 |
| 2014 | $4,690 | $246,969 | $63,177 | $183,792 |
Source: Public Records
Map
Nearby Homes
- 29342 Artillery Cir
- 29413 Artillery Cir
- 24765 Las Flores Dr
- 29543 Laredo Cir
- 29608 Laredo Cir
- 29063 Boulder Crest Way
- 25106 Wooden Gate Dr
- 29324 Wagon Creek Ln
- 25004 Crestpeak Ct
- 29003 Boulder Crest Way
- 25164 Country Fair Dr
- 29710 Western Front Dr
- 25180 Juno St
- 25321 Silverwood Ln
- 24460 Conejo Dr
- 25266 Shady Creek Cir
- 29822 Cool Meadow Dr
- 31723 Constellation Dr
- 29720 Morning Breeze Dr
- 24668 Legion Ct
- 24829 Springbrook Way
- 24805 Springbrook Way
- 24793 Springbrook Way
- 24841 Springbrook Way
- 29364 Rockview Ct
- 24853 Springbrook Way
- 24781 Springbrook Way
- 29353 Artillery Cir
- 24812 Springbrook Way
- 24800 Springbrook Way
- 24824 Springbrook Way
- 29376 Rockview Ct
- 24788 Springbrook Way
- 24865 Springbrook Way
- 29365 Artillery Cir
- 24836 Springbrook Way
- 24769 Springbrook Way
- 29375 Rockview Ct
- 24776 Springbrook Way
- 29388 Rockview Ct
Your Personal Tour Guide
Ask me questions while you tour the home.