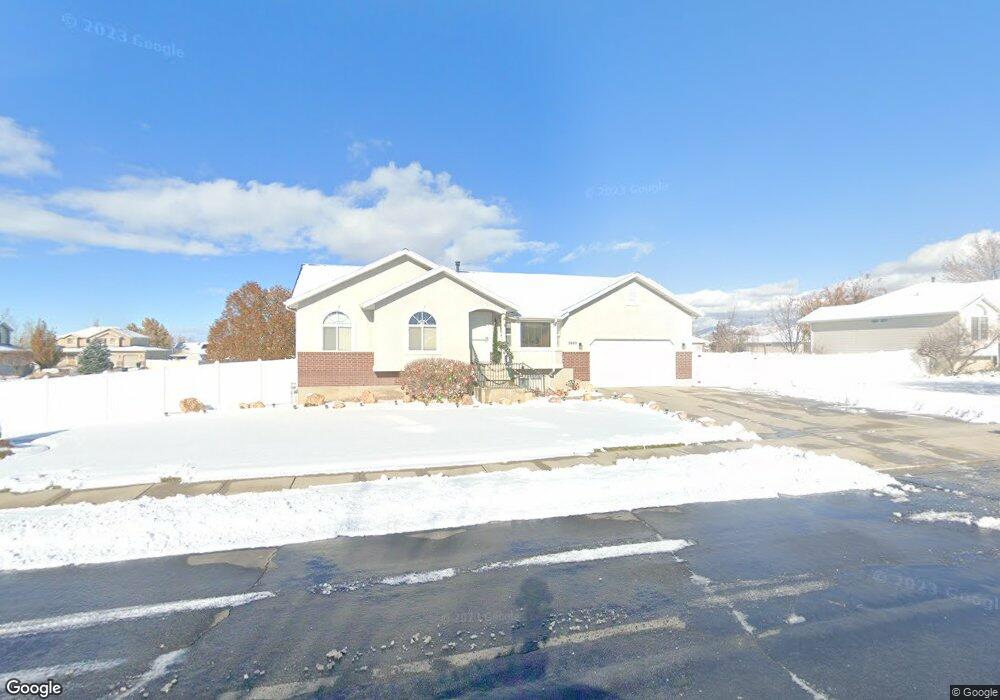
2482 W 2450 N Clearfield, UT 84015
Estimated Value: $468,000 - $524,540
3
Beds
2
Baths
2,496
Sq Ft
$201/Sq Ft
Est. Value
About This Home
This home is located at 2482 W 2450 N, Clearfield, UT 84015 and is currently estimated at $501,385, approximately $200 per square foot. 2482 W 2450 N is a home located in Davis County with nearby schools including West Clinton Elementary School, West Point Junior High School, and Clearfield High School.
Ownership History
Date
Name
Owned For
Owner Type
Purchase Details
Closed on
Apr 28, 2003
Sold by
Federal National Mortgage Association
Bought by
Decker Wayne S
Current Estimated Value
Home Financials for this Owner
Home Financials are based on the most recent Mortgage that was taken out on this home.
Original Mortgage
$141,007
Outstanding Balance
$59,641
Interest Rate
5.54%
Mortgage Type
FHA
Estimated Equity
$441,744
Purchase Details
Closed on
Jan 22, 2003
Sold by
Anglin Steven and Anglin Racquel
Bought by
Federal National Mortgage Association
Purchase Details
Closed on
Jan 11, 2000
Sold by
Sli Commercial Real Estate Co
Bought by
Anglin Steven and Anglin Racquel
Home Financials for this Owner
Home Financials are based on the most recent Mortgage that was taken out on this home.
Original Mortgage
$137,500
Interest Rate
7.83%
Create a Home Valuation Report for This Property
The Home Valuation Report is an in-depth analysis detailing your home's value as well as a comparison with similar homes in the area
Home Values in the Area
Average Home Value in this Area
Purchase History
| Date | Buyer | Sale Price | Title Company |
|---|---|---|---|
| Decker Wayne S | $143,000 | Us Title | |
| Federal National Mortgage Association | $165,929 | -- | |
| Anglin Steven | -- | Bonneville Title Company Inc |
Source: Public Records
Mortgage History
| Date | Status | Borrower | Loan Amount |
|---|---|---|---|
| Open | Decker Wayne S | $141,007 | |
| Previous Owner | Anglin Steven | $137,500 |
Source: Public Records
Tax History Compared to Growth
Tax History
| Year | Tax Paid | Tax Assessment Tax Assessment Total Assessment is a certain percentage of the fair market value that is determined by local assessors to be the total taxable value of land and additions on the property. | Land | Improvement |
|---|---|---|---|---|
| 2025 | $2,711 | $260,700 | $104,000 | $156,700 |
| 2024 | $2,726 | $263,450 | $112,281 | $151,169 |
| 2023 | $2,600 | $465,000 | $131,335 | $333,665 |
| 2022 | $2,774 | $274,450 | $76,011 | $198,439 |
| 2021 | $2,446 | $359,000 | $102,546 | $256,454 |
| 2020 | $2,141 | $311,000 | $91,292 | $219,708 |
| 2019 | $2,086 | $296,000 | $99,078 | $196,922 |
| 2018 | $1,973 | $275,000 | $82,735 | $192,265 |
| 2016 | $1,776 | $127,875 | $33,046 | $94,829 |
| 2015 | $1,777 | $121,605 | $33,046 | $88,559 |
| 2014 | $1,681 | $116,856 | $33,046 | $83,810 |
| 2013 | -- | $111,017 | $30,667 | $80,350 |
Source: Public Records
Map
Nearby Homes
- 2322 N 2500 W
- 2592 W 2650 N
- 2434 W 2250 N
- 2241 W 2475 N
- 2219 N 2475 W
- Harvard Plan at Summerfield - Enclave
- 2208 W 2615 N
- Linden Plan at Summerfield - Vista
- Yale Plan at Summerfield - Enclave
- Gambel Oak Plan at Summerfield - Vista
- Cedar Plan at Summerfield - Vista
- Elm Plan at Summerfield - Vista
- Princeton Plan at Summerfield - Enclave
- Cambridge Plan at Summerfield - Enclave
- Cornell Plan at Summerfield - Enclave
- Sycamore Plan at Summerfield - Vista
- Berkeley Plan at Summerfield - Enclave
- Birch Plan at Summerfield - Vista
- Stanford Plan at Summerfield - Enclave
- 2622 N 2125 W Unit 146