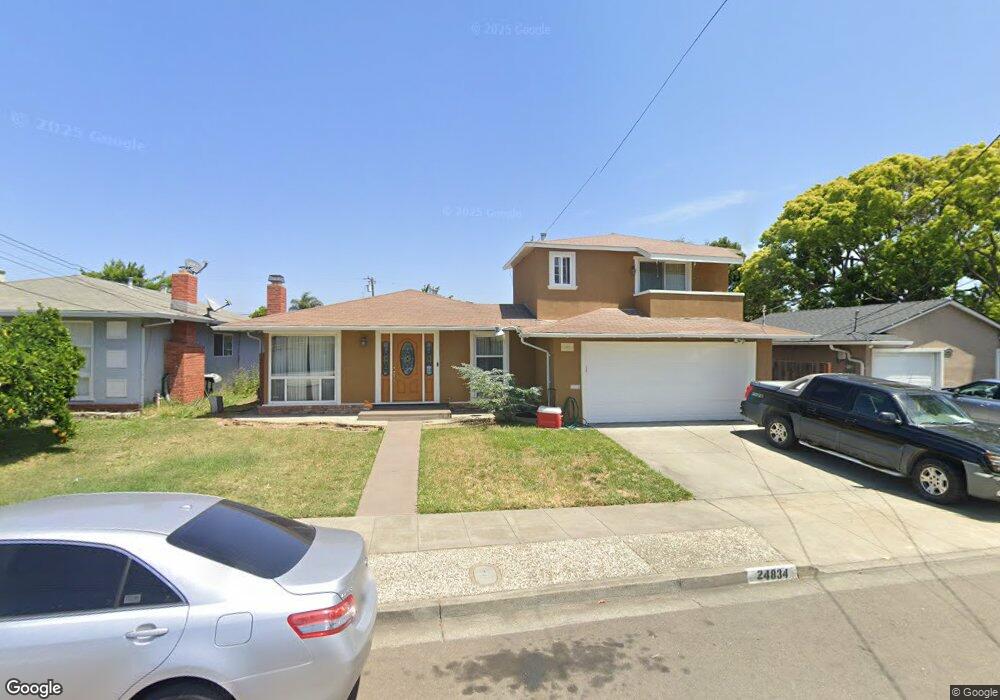
24834 Willimet Way Hayward, CA 94544
Santa Clara NeighborhoodEstimated Value: $806,000 - $913,000
4
Beds
4
Baths
1,144
Sq Ft
$755/Sq Ft
Est. Value
About This Home
This home is located at 24834 Willimet Way, Hayward, CA 94544 and is currently estimated at $864,260, approximately $755 per square foot. 24834 Willimet Way is a home located in Alameda County with nearby schools including Park Elementary School, Winton Middle School, and Mt. Eden High School.
Ownership History
Date
Name
Owned For
Owner Type
Purchase Details
Closed on
Dec 4, 2014
Sold by
Nobles Lisa
Bought by
Nobles Mark D
Current Estimated Value
Home Financials for this Owner
Home Financials are based on the most recent Mortgage that was taken out on this home.
Original Mortgage
$292,266
Outstanding Balance
$224,121
Interest Rate
3.95%
Mortgage Type
New Conventional
Estimated Equity
$640,139
Purchase Details
Closed on
Sep 26, 2001
Sold by
Nobles Mark D
Bought by
Nobles Mark D
Home Financials for this Owner
Home Financials are based on the most recent Mortgage that was taken out on this home.
Original Mortgage
$219,000
Interest Rate
6.9%
Purchase Details
Closed on
Feb 23, 2000
Sold by
Nobles Cheryl Y
Bought by
Nobles Mark D
Home Financials for this Owner
Home Financials are based on the most recent Mortgage that was taken out on this home.
Original Mortgage
$216,800
Interest Rate
8.16%
Purchase Details
Closed on
Apr 24, 1996
Sold by
Flotte Refugio
Bought by
Nobles Mark D and Nobles Cheryl Y
Home Financials for this Owner
Home Financials are based on the most recent Mortgage that was taken out on this home.
Original Mortgage
$150,000
Interest Rate
7.82%
Create a Home Valuation Report for This Property
The Home Valuation Report is an in-depth analysis detailing your home's value as well as a comparison with similar homes in the area
Home Values in the Area
Average Home Value in this Area
Purchase History
| Date | Buyer | Sale Price | Title Company |
|---|---|---|---|
| Nobles Mark D | -- | First American Title Company | |
| Nobles Mark D | -- | Landsafe Title | |
| Nobles Mark D | -- | Commonwealth Land Title Co | |
| Nobles Mark D | $193,000 | Fidelity National Title Ins |
Source: Public Records
Mortgage History
| Date | Status | Borrower | Loan Amount |
|---|---|---|---|
| Open | Nobles Mark D | $292,266 | |
| Closed | Nobles Mark D | $219,000 | |
| Closed | Nobles Mark D | $216,800 | |
| Closed | Nobles Mark D | $150,000 |
Source: Public Records
Tax History Compared to Growth
Tax History
| Year | Tax Paid | Tax Assessment Tax Assessment Total Assessment is a certain percentage of the fair market value that is determined by local assessors to be the total taxable value of land and additions on the property. | Land | Improvement |
|---|---|---|---|---|
| 2025 | $4,017 | $313,603 | $96,181 | $224,422 |
| 2024 | $4,017 | $307,317 | $94,295 | $220,022 |
| 2023 | $3,957 | $308,154 | $92,446 | $215,708 |
| 2022 | $3,882 | $295,114 | $90,634 | $211,480 |
| 2021 | $3,849 | $289,190 | $88,857 | $207,333 |
| 2020 | $3,807 | $293,154 | $87,946 | $205,208 |
| 2019 | $3,835 | $287,407 | $86,222 | $201,185 |
| 2018 | $3,607 | $281,773 | $84,532 | $197,241 |
| 2017 | $3,526 | $276,250 | $82,875 | $193,375 |
| 2016 | $3,314 | $270,834 | $81,250 | $189,584 |
| 2015 | $3,250 | $266,767 | $80,030 | $186,737 |
| 2014 | $3,092 | $261,543 | $78,463 | $183,080 |
Source: Public Records
Map
Nearby Homes
- 794 Resota St
- 512 Teasdale Place
- 25275 Tarman Ave
- 25353 Tarman Ave
- 25163 Copa Del Oro Dr Unit 202
- 522 Lagunitas Ln
- 24796 Pear St
- 565 Lagunitas Ln
- 1256 Stanhope Ln Unit 254
- 26171 Eldridge Ave
- 24970 Cypress Ave
- 1280 Stanhope Ln Unit 343
- 24282 Willimet Way
- 1234 Stanhope Ln Unit 267
- 99 Austin Ave
- 73 Fernridge Ct Unit 73
- 25930 Kay Ave Unit 201
- 25930 Kay Ave Unit 308
- 24548 Autumn Mist Way
- 24500 Autumn Mist Way
- 24826 Willimet Way
- 24826 Willimet Way
- 24835 Woodacre Ave
- 24843 Woodacre Ave
- 24827 Woodacre Ave
- 24827 Woodacre Ave
- 24818 Willimet Way
- 24841 Willimet Way
- 24819 Woodacre Ave
- 24849 Willimet Way
- 24825 Willimet Way
- 24810 Willimet Way
- 24866 Willimet Way
- 24811 Woodacre Ave
- 24857 Willimet Way
- 24817 Willimet Way
- 688 Banbury St
- 24802 Willimet Way
- 24865 Willimet Way
- 24844 Woodacre Ave