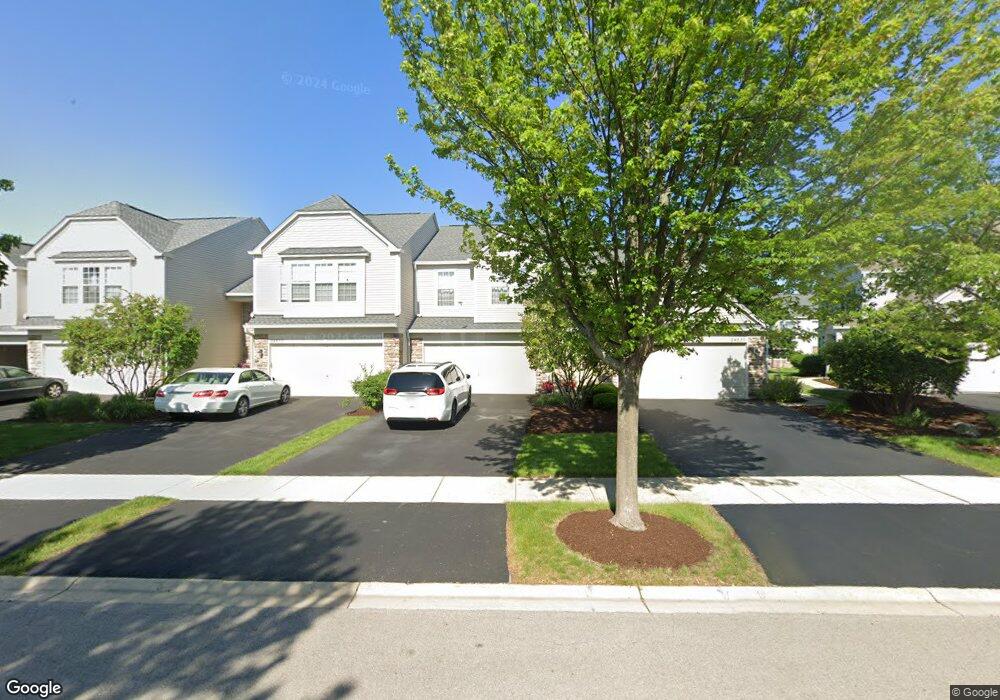
24835 Franklin Ln Unit 266B Plainfield, IL 60585
North Plainfield NeighborhoodEstimated Value: $279,000 - $321,000
3
Beds
2
Baths
1,573
Sq Ft
$192/Sq Ft
Est. Value
About This Home
This home is located at 24835 Franklin Ln Unit 266B, Plainfield, IL 60585 and is currently estimated at $301,900, approximately $191 per square foot. 24835 Franklin Ln Unit 266B is a home located in Will County with nearby schools including Freedom Elementary School, Heritage Grove Middle School, and Plainfield North High School.
Ownership History
Date
Name
Owned For
Owner Type
Purchase Details
Closed on
Jun 28, 2019
Sold by
Torres Ismael and Torres Manuela
Bought by
Torres Daniel
Current Estimated Value
Home Financials for this Owner
Home Financials are based on the most recent Mortgage that was taken out on this home.
Original Mortgage
$138,380
Interest Rate
4.5%
Mortgage Type
FHA
Purchase Details
Closed on
May 24, 2013
Sold by
Ropeta Necipura B and Ropeta Leo B
Bought by
Torres Ismael and Torres Manuela
Home Financials for this Owner
Home Financials are based on the most recent Mortgage that was taken out on this home.
Original Mortgage
$100,320
Interest Rate
5.37%
Mortgage Type
New Conventional
Purchase Details
Closed on
Oct 30, 2003
Sold by
Pulte Homes
Bought by
Ropeta Necipura B and Ropeta Leo B
Home Financials for this Owner
Home Financials are based on the most recent Mortgage that was taken out on this home.
Original Mortgage
$156,906
Interest Rate
6.1%
Mortgage Type
Purchase Money Mortgage
Create a Home Valuation Report for This Property
The Home Valuation Report is an in-depth analysis detailing your home's value as well as a comparison with similar homes in the area
Home Values in the Area
Average Home Value in this Area
Purchase History
We collect this data history from publicly available records. To have your information removed, we recommend requesting removal directly through your county’s website.
| Date | Buyer | Sale Price | Title Company |
|---|---|---|---|
| Torres Daniel | $160,000 | Barrister Title | |
| Torres Ismael | $125,400 | Fidelity National Title | |
| Ropeta Necipura B | $174,500 | First American Title |
Source: Public Records
Mortgage History
We collect this data history from publicly available records. To have your information removed, we recommend requesting removal directly through your county’s website.
| Date | Status | Borrower | Loan Amount |
|---|---|---|---|
| Previous Owner | Torres Daniel | $138,380 | |
| Previous Owner | Torres Ismael | $100,320 | |
| Previous Owner | Ropeta Necipura B | $156,906 |
Source: Public Records
Tax History
| Year | Tax Paid | Tax Assessment Tax Assessment Total Assessment is a certain percentage of the fair market value that is determined by local assessors to be the total taxable value of land and additions on the property. | Land | Improvement |
|---|---|---|---|---|
| 2024 | $5,921 | $84,859 | $23,464 | $61,395 |
| 2023 | $5,594 | $74,964 | $20,728 | $54,236 |
| 2022 | $4,872 | $66,796 | $19,609 | $47,187 |
| 2021 | $4,681 | $63,615 | $18,675 | $44,940 |
| 2020 | $4,673 | $62,607 | $18,379 | $44,228 |
| 2019 | $5,099 | $60,843 | $17,861 | $42,982 |
| 2018 | $4,708 | $55,058 | $17,467 | $37,591 |
| 2017 | $4,691 | $53,637 | $17,016 | $36,621 |
| 2016 | $4,708 | $52,483 | $16,650 | $35,833 |
| 2015 | $5,008 | $50,465 | $16,010 | $34,455 |
| 2014 | $5,008 | $52,987 | $16,010 | $36,977 |
| 2013 | $5,008 | $52,987 | $16,010 | $36,977 |
Source: Public Records
Map
Nearby Homes
- 24850 Franklin Ln Unit 105A
- 24902 Franklin Ln Unit 114
- 24924 Franklin Ln Unit 123
- 24944 Franklin Ln Unit 131
- 0 W 119th St
- 11640 Century Cir
- 25016 Rockwell Ln
- 11616 Century Cir
- 24813 Ironwood Ct
- 25018 Armstrong Ln Unit 4D
- 24963 Heritage Oaks Dr
- 4119 Champion Rd
- 4304 Champion Rd
- 4128 Callery Rd
- 24833 Winterberry Ln
- 4031 Juneberry Rd Unit 1
- 24329 Leski Ln Unit 1
- 12740 S Nicholas Dr
- 12764 S Nicholas Dr
- 24405 Glenbrook Ct
- 24850 Gates Ln Unit 76A
- 24854 Gates Ln Unit 74D
- 24860 Gates Ln Unit 71A
- 24856 Gates Ln Unit 73C
- 24852 Gates Ln Unit 75B
- 24858 Gates Ln Unit 72B
- 24862 W Gates Ln Unit 66A
- 24862 W Gates Ln Unit 24862
- 24902 Gates Ln Unit 63C
- 24864 Gates Ln Unit 65B
- 24904 Gates Ln Unit B
- 24906 Gates Ln Unit 61A
- 24900 Gates Ln Unit 64C
- 24904 Gates Ln Unit 2492
- 24846 Gates Ln Unit 82B
- 24840 Gates Ln Unit 85E
- 24848 Gates Ln Unit 81A
- 24844 Gates Ln Unit 83D
- 24847 Gates Ln Unit END
- 24847 Gates Ln
Your Personal Tour Guide
Ask me questions while you tour the home.