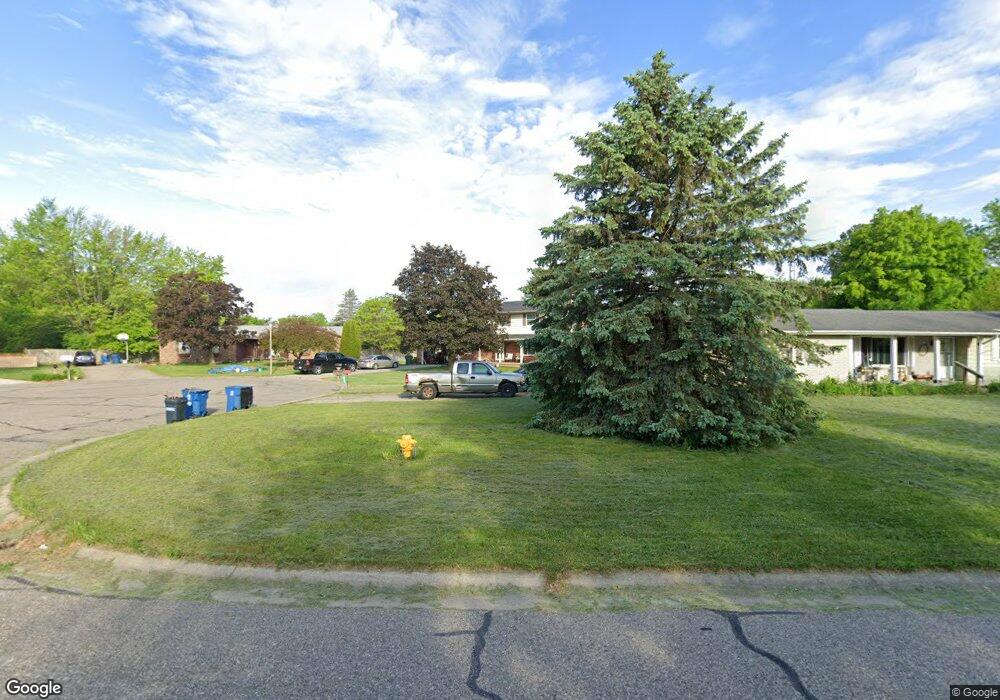
2485 Plainview Dr Flushing, MI 48433
Estimated Value: $242,162 - $313,000
3
Beds
2
Baths
1,780
Sq Ft
$164/Sq Ft
Est. Value
About This Home
This home is located at 2485 Plainview Dr, Flushing, MI 48433 and is currently estimated at $291,791, approximately $163 per square foot. 2485 Plainview Dr is a home located in Genesee County with nearby schools including Seymour Elementary School, Flushing Middle School, and Flushing High School.
Ownership History
Date
Name
Owned For
Owner Type
Purchase Details
Closed on
May 7, 2010
Sold by
Bowdens Brian and Heystek Robyn
Bought by
Maynard Eric C and Maynard Julie E
Current Estimated Value
Purchase Details
Closed on
May 13, 2008
Sold by
Heystek Nancy
Bought by
Heystek Robyn
Purchase Details
Closed on
Apr 16, 2007
Sold by
The Peter A Asencio & F Ellen Millar Rev
Bought by
Heystek Robyn and Heystek Nancy
Purchase Details
Closed on
May 22, 2001
Sold by
Asencio Peter A
Bought by
Revocab Peter A Asencio and Ellen Millar Revocab F
Create a Home Valuation Report for This Property
The Home Valuation Report is an in-depth analysis detailing your home's value as well as a comparison with similar homes in the area
Home Values in the Area
Average Home Value in this Area
Purchase History
| Date | Buyer | Sale Price | Title Company |
|---|---|---|---|
| Maynard Eric C | $115,000 | Sargents Title Company | |
| Heystek Robyn | -- | None Available | |
| Heystek Robyn | $137,000 | Blue Sky Title Llc | |
| Revocab Peter A Asencio | -- | -- |
Source: Public Records
Tax History
| Year | Tax Paid | Tax Assessment Tax Assessment Total Assessment is a certain percentage of the fair market value that is determined by local assessors to be the total taxable value of land and additions on the property. | Land | Improvement |
|---|---|---|---|---|
| 2025 | $2,371 | $102,900 | $0 | $0 |
| 2024 | $1,139 | $110,900 | $0 | $0 |
| 2023 | $1,087 | $101,200 | $0 | $0 |
| 2022 | $2,082 | $85,900 | $0 | $0 |
| 2021 | $2,062 | $81,100 | $0 | $0 |
| 2020 | $1,011 | $67,800 | $0 | $0 |
| 2019 | $1,000 | $69,400 | $0 | $0 |
| 2018 | $1,926 | $62,800 | $0 | $0 |
| 2017 | $1,757 | $62,800 | $0 | $0 |
| 2016 | $1,729 | $63,100 | $0 | $0 |
| 2015 | $1,531 | $64,900 | $0 | $0 |
| 2014 | $871 | $58,400 | $0 | $0 |
| 2012 | -- | $45,200 | $45,200 | $0 |
Source: Public Records
Map
Nearby Homes
- 2366 Lost Creek Ct
- 8399 Potter Rd
- 2444 Shade Grove Dr
- 2390 Double Tree Dr
- 7444 Potter Rd
- 2300 N Mckinley Rd
- 746 Bending Brook Dr
- 7505 Falling Leaf Ct
- 516 Sunnyslope Dr
- 748 Bending Ct
- 3155 Beech Tree Ln
- 6106 E River Rd
- 000 Potter Rd
- 2112 Morrish Rd
- 608 Autumn Dr
- 0 Crooked Limb Ct
- 8040 Beecher Rd
- 3230 Woodvalley Dr
- 0 Winters Eave Dr Unit 50117986
- 0 E River Rd Unit 50180952
- 2491 Plainview Dr
- 2477 Plainview Dr
- 2505 Plainview Dr
- 2467 Plainview Dr
- 8257 Potter Rd
- 8283 Potter Rd Unit Bldg-Unit
- 8283 Potter Rd
- 2482 Plainview Dr
- 2490 Plainview Dr
- 2457 Plainview Dr
- 2474 Plainview Dr
- 2517 Plainview Dr
- 2498 Plainview Dr
- 2506 Plainview Dr
- 2464 Plainview Dr
- 2449 Plainview Dr
- 2454 Plainview Dr
- 2518 Plainview Dr
- 2485 Lost Creek Dr
- 2491 Lost Creek Dr
Your Personal Tour Guide
Ask me questions while you tour the home.